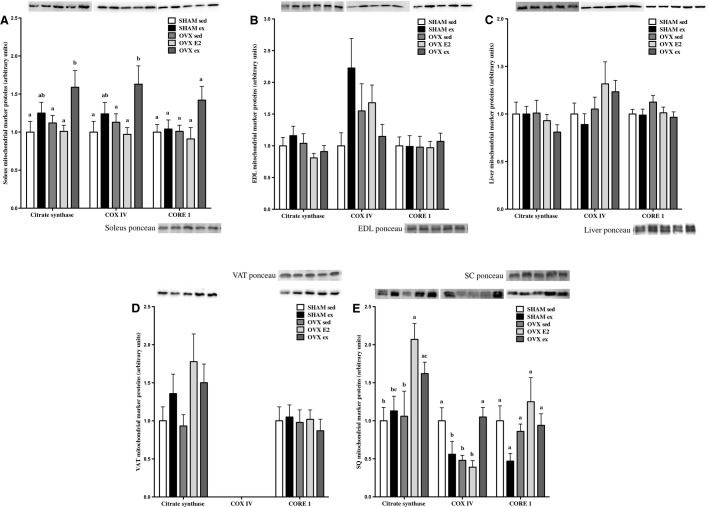
Figure 6.
Protein content of mitochondrial markers citrate synthase, COXIV, and core1 in soleus, EDL, liver, VAT, and SQ tissues (A–E). Data are expressed as mean ± standard error, n = 10 per group. Within each target protein in each tissue, groups which share a letter are not significantly different. Statistical significance is accepted at P < 0.05. In panel A: between-group differences in core1 P = 0.06, in panel B: between-group differences in COXIV P = 0.06, in panel E: between-group differences in core1 P = 0.08 as assessed by one-way ANOVA.

