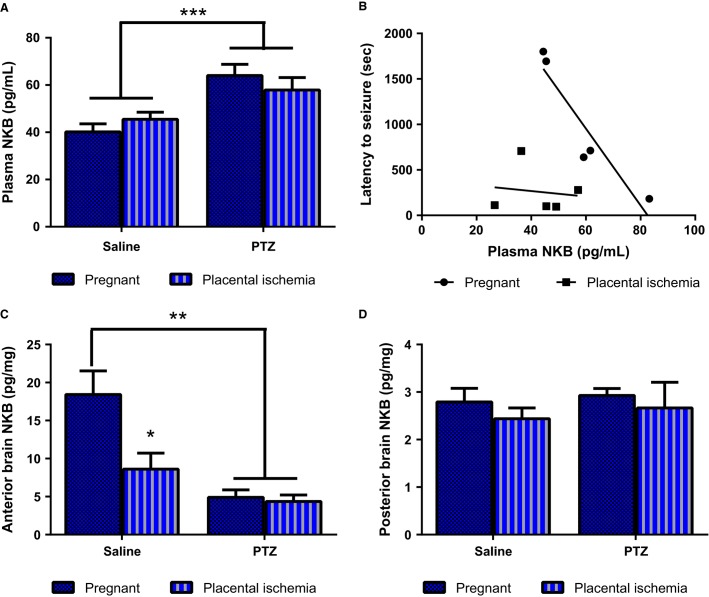
Figure 3.
Changes in plasma and brain levels of neurokinin B. (A) Plasma NKB levels are increased in response to PTZ treatment. (B) Relationship between plasma NKB levels and latency to seizures. (C) Anterior brain NKB levels. (D) Posterior brain NKB levels. Bars represent Mean ± SEM. ***P < 0.001, **P < 0.01, *P < 0.05. N = 11–13 per group/treatment.

