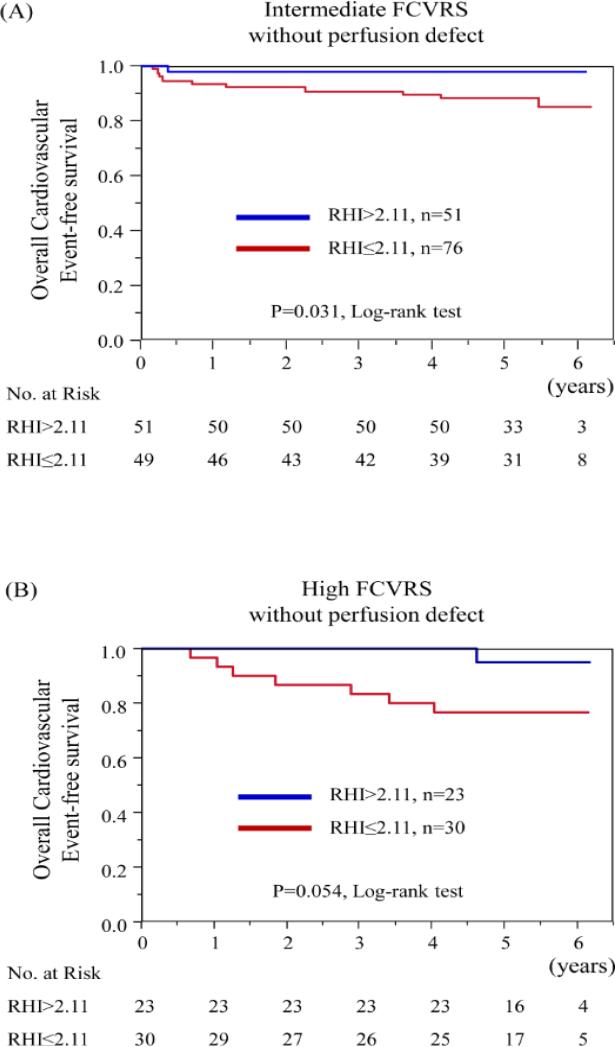
Figure 2. Kaplan-Meier analysis for the probability of cardiovascular events according to RHI in each group by Framingham risk category and myocardial perfusion defect.
(A) Kaplan-Meier curves according to RHI in intermediate FCVRS with PD (−) group. (B) Kaplan-Meier curves according to RHI in high FCVRS with PD (−) group. FCVRS: Framingham Cardiovascular Risk Score, PD: perfusion defect, and RHI: reactive hyperemia-peripheral arterial tonometry index.

