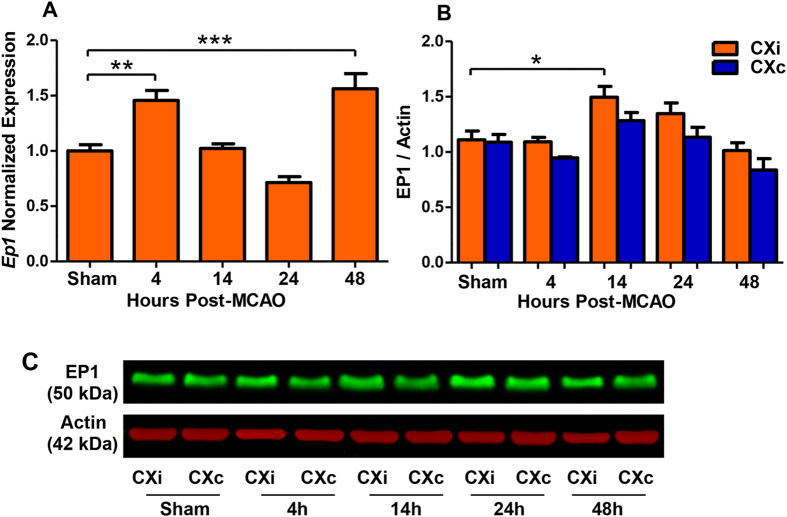
Figure 1. Time course of EP1 expression after cerebral ischemia in rats.
EP1 mRNA expression in the ischemic cortex and EP1 protein levels in the ischemic and contralateral hemispheres were measured in sham-operated and 4, 14, 24, and 48 h after the onset of occlusion. (A) EP1 mRNA is increased at 4 h (P < 0.01, one-way ANOVA) and 48 h after occlusion (P < 0.001, one-way ANOVA) compared to the sham. (B) EP1 protein levels are elevated in the ischemic cortex 14 h after occlusion compared to the sham (P < 0.05, two-tailed unpaired t-test). (C) A representative immunoblot of EP1 expression in the cortex over time in response to ischemia. Sham, N = 5; 4 h, N = 5; 14 h, N = 6; 24 h, N = 8; 48 h, N = 7. CXi = Cortex ipsilateral to stroke; CXc = Cortex contralateral to stroke.

