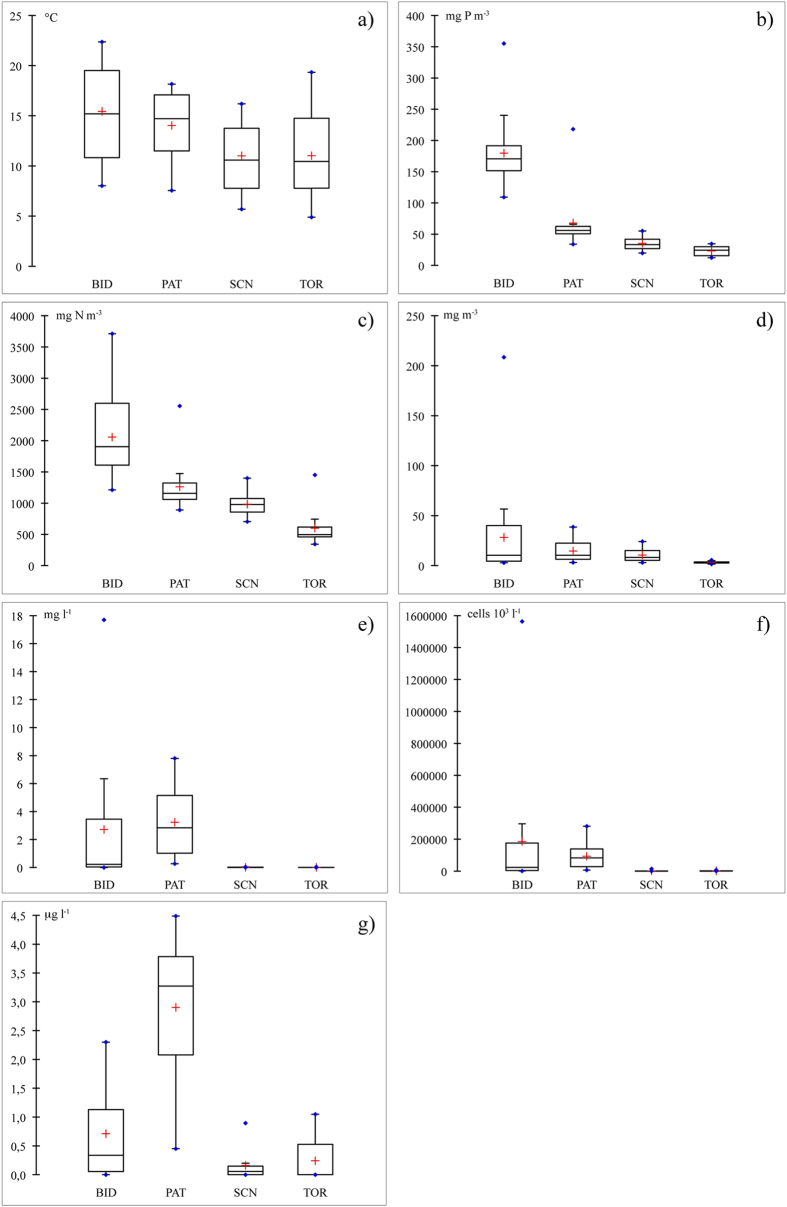
Figure 2. Boxplots of (a) temperature, (b) TP, (c) TN, (d) Chl a, (e) biomass, and (f) cell abundance of cyanobacteria and (g) MCs in the reservoirs.
Box plots were constructed considering total dataset (all samplings) of averaged values along vertical profile for temperature, TP, and TN; weighted means in the photic zone for Chl a, and biomass and cell abundance of cyanobacteria; and MCs concentrations at superficial depth (0.5 m). Line inside box represents the median; cross inside box represents mean; points represent maxima and minima. Bottom of box is the first quartile; upper part is the third quartile. Whiskers represent limits over which values were considered anomalous.

