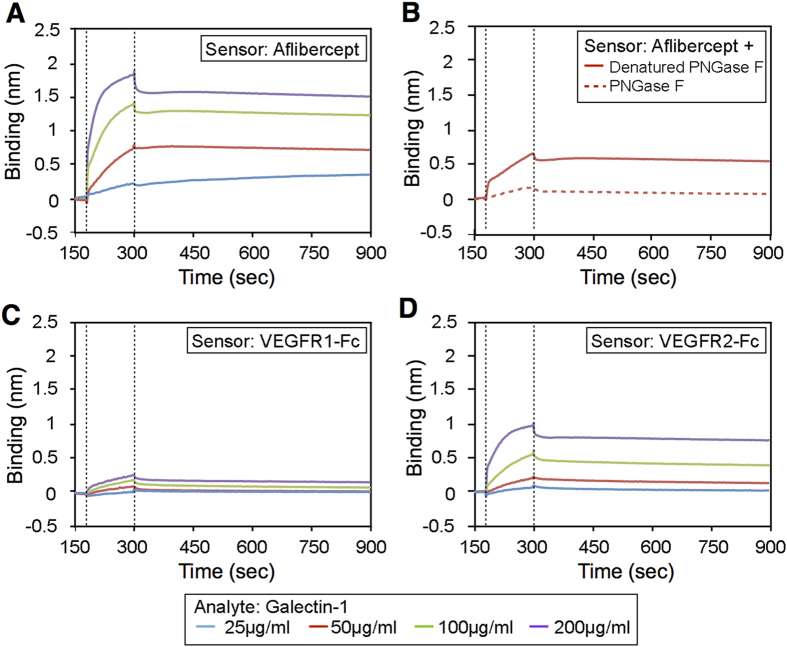
Figure 2. Binding affinity of aflibercept with galectin-1.
(A) Kinetic analysis of galectin-1 binding with aflibercept using the BLItz biolayer interferometry system. Sensorgrams obtained using aflibercept-loaded biosensors incubated with different concentrations of galectin-1 as analytes. Dotted lines indicate the start of the binding (left) and the dissociation (right) phase. (B) Sensorgrams obtained using biosensors loaded with aflibercept with (dotted line) or without (solid line) deglycosylation (+ PNGase F or Denatured PNGase F, respectively) and incubated with galectin-1 at the concentration of 50 μg/ml. (C,D) Sensorgrams obtained using biosensors loaded with VEGFR1-Fc (C) or VEGFR2-Fc (D) and incubated with different concentrations of galectin-1.

