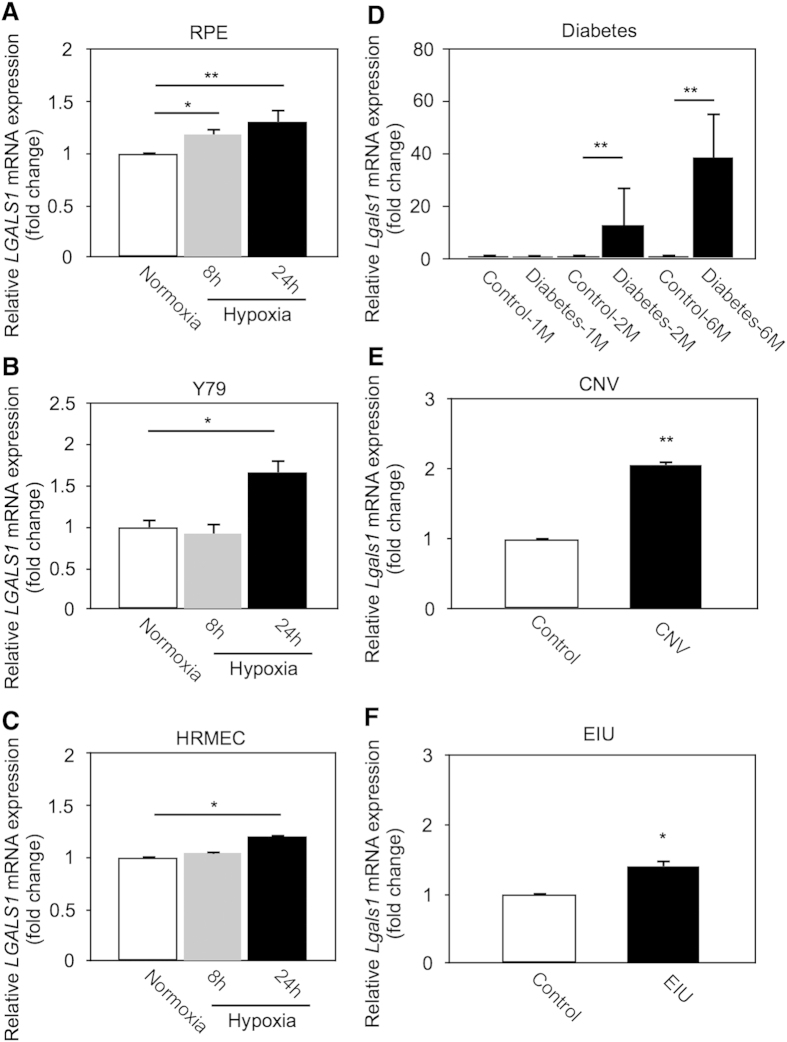
Figure 3. Induction of retinal Galectin-1/LGALS1 mRNA in vitro and in vivo.
(A–C) LGALS1 mRNA expression in hypoxia (1% O2)-stimulated cell culture using RPE (A), Y79 (B) and HRMEC (C). (D–F) Lgals1 mRNA expression in retinal tissues from disease model mice with streptozotocin-induced diabetes (D), CNV (E) and EIU (F). *p < 0.05, **p < 0.01 (n = 6 per group).

