
Fig. 1.
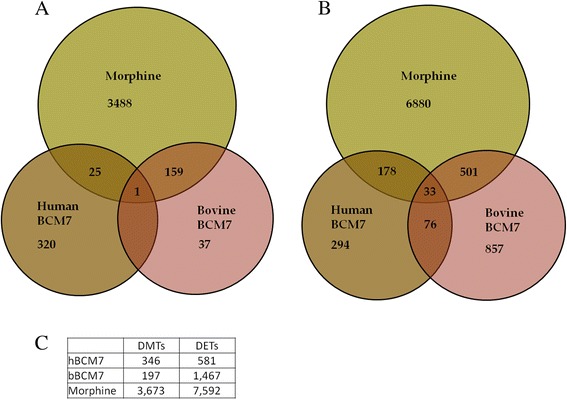
Venn diagrams representing overlap in DETs and DMTs between treatment conditions. SH-SY5Y human neuroblastoma cells were treated with 1 μM morphine, bBCM7 or hBCM7 for 4 h (n = 5). Gene expression was analyzed by genome-wide microarray to generate lists of differentially expressed transcripts (DETs; Panel a and DNA methylation was analyzed by MBD-seq to yield lists of differentially methylated transcripts (DMTs; Panel b DMTs and DETs were plotted to illustrate overlapping transcript changes caused by one or more of the treatment groups compared with non-treated control. For DETs, N = 3; fold change ≥ 1.5; raw p ≤ 0.05. For DMTs, N = 5, FDR < 0.1