
Fig. 4.
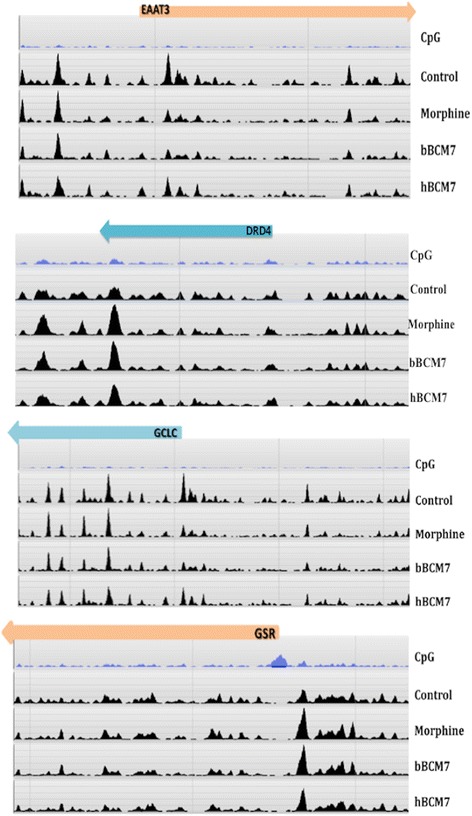
DNA-methylation distribution of genes involved in transsulfuration pathway. Gene-specific graphical representation of distribution of methylation peaks for the genes involved in the transsulfuration pathway. The Refseq genes are shown in orange / blue color. The CpG density for the specific region of the gene is also indicated. Reference genome is from the H2G2 genome browser which uses the hg19 version of the human genome