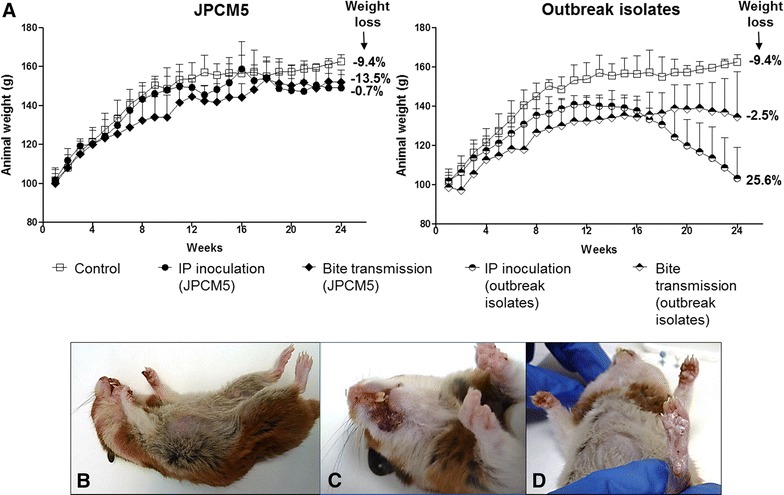
Figure 2.

Leishmaniasis follow-up over 24 weeks. A Animal weight follow-up. Bars represent standard deviation among animals within the same group. Weight loss is indicated in the right side of each plot. Weight loss was calculated using the following formula: 100 – [100*(weight average at week 10/weight average at week 24)]. A positive number indicates weight loss while negative numbers show weight gain; B General clinicopathologic features in representative sick hamsters infected with outbreak isolates. General condition; C Leishmaniasis skin lessions on mouth and D hindpaw of hamsters infected with POL2FL6.
