
Fig. 5.
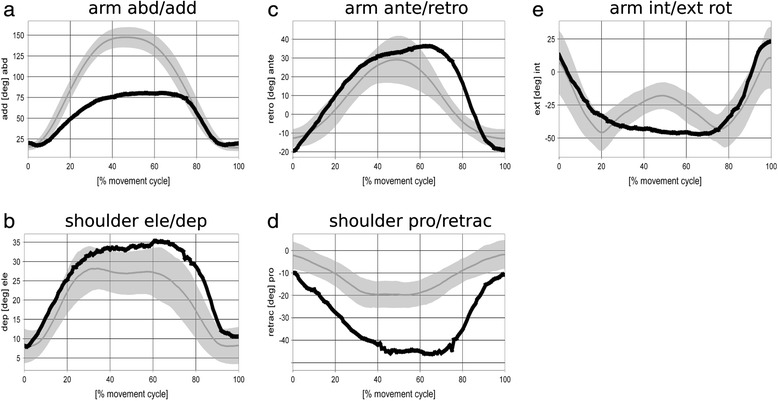
Motion graphs for bilateral arm ab-/adduction: Gray bands represent mean and SD for the reference group of 8 healthy subjects. Data of a sample patient with glenohumeral osteoarthritis are shown in black
Official websites use .gov
A
.gov website belongs to an official
government organization in the United States.
Secure .gov websites use HTTPS
A lock (
) or https:// means you've safely
connected to the .gov website. Share sensitive
information only on official, secure websites.
Motion graphs for bilateral arm ab-/adduction: Gray bands represent mean and SD for the reference group of 8 healthy subjects. Data of a sample patient with glenohumeral osteoarthritis are shown in black