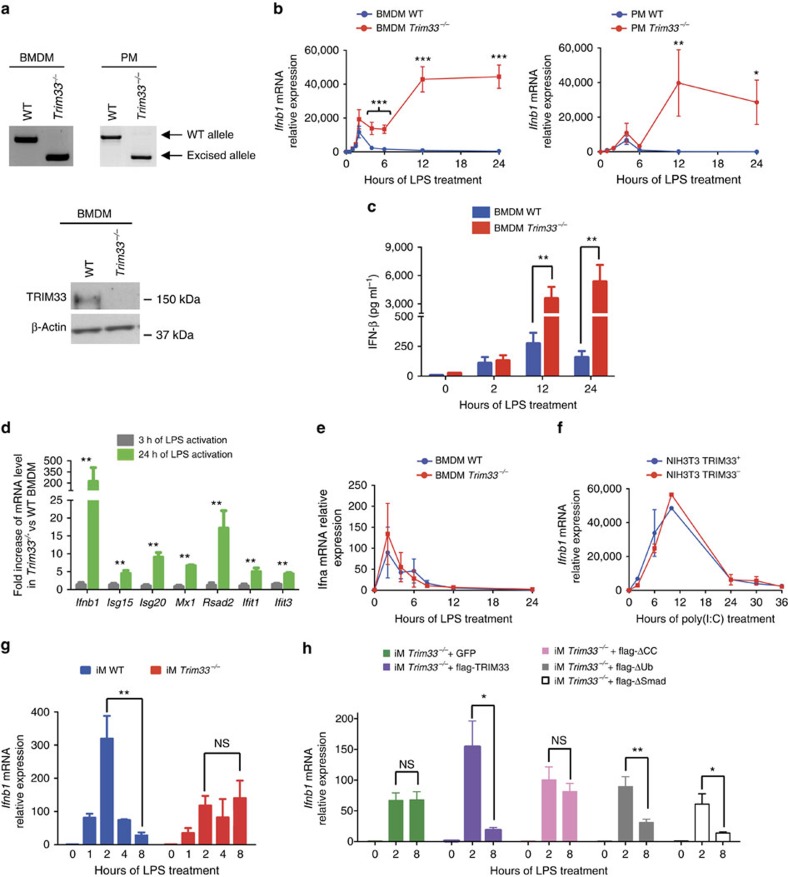
Figure 1. TRIM33 regulates Ifnb1 gene expression in activated macrophages.
(a) Genomic PCR detection of Trim33 in BMDM and PM (top) and western blot analysis of TRIM33 in BMDM from WT and Trim33−/− mice (bottom). (b) Kinetics of Ifnb1 mRNA levels in WT and Trim33−/− BMDM (left panel) or PM (right panel) after activation with LPS. Mean±s.e.m., n=3 to 6. (c) IFN-β protein levels in supernatants of non-activated and LPS-activated WT and Trim33−/− BMDM. Mean±s.e.m., n=4. (d) Relative mRNA levels of Ifnb1 and IFN-β target genes in Trim33−/− BMDM versus WT BMDM treated with LPS (0.1 ng ml−1) for 3 or 24 h. Mean±s.e.m., n=3. (e) Kinetics of Ifna mRNA levels in WT and Trim33−/− BMDM activated with LPS. Mean±s.e.m., n=3. (f) Kinetics of Ifnb1 mRNA levels in NIH3T3 cells expressing a shRNA targeting Trim33 (NIH3T3 TRIM33−) or luciferase (NIH3T3 TRIM33+) and activated with poly(I:C). Mean±s.e.m., n=3. (g) Kinetics of Ifnb1 mRNA levels in WT and Trim33−/− iM treated for the indicated times with LPS. Mean±s.e.m., n=3. (h) Relative expression of Ifnb1 mRNA 0, 2 and 8 h after LPS treatment of Trim33−/− iM transduced with a lentivirus coding for GFP (iM Trim33−/− +GFP), for full-length flag-TRIM33 and GFP (iM Trim33−/− +flag-TRIM33) or for flag-TRIM33 mutants lacking the coiled-coil domain (iM Trim33−/− +flag-ΔCC), the ubiquitin ligase activity (iM Trim33−/− +flag-ΔUb) or the SMAD-interaction domain (iM Trim33−/− +flag-ΔSMAD). Mean±s.e.m., n=5. All qRT-PCR data are normalized to HPRT and, unless otherwise indicated, presented relative to expression of untreated WT cells. *P<0.05; **P<0.01 and ***P<0.001, Mann–Whitney test.

