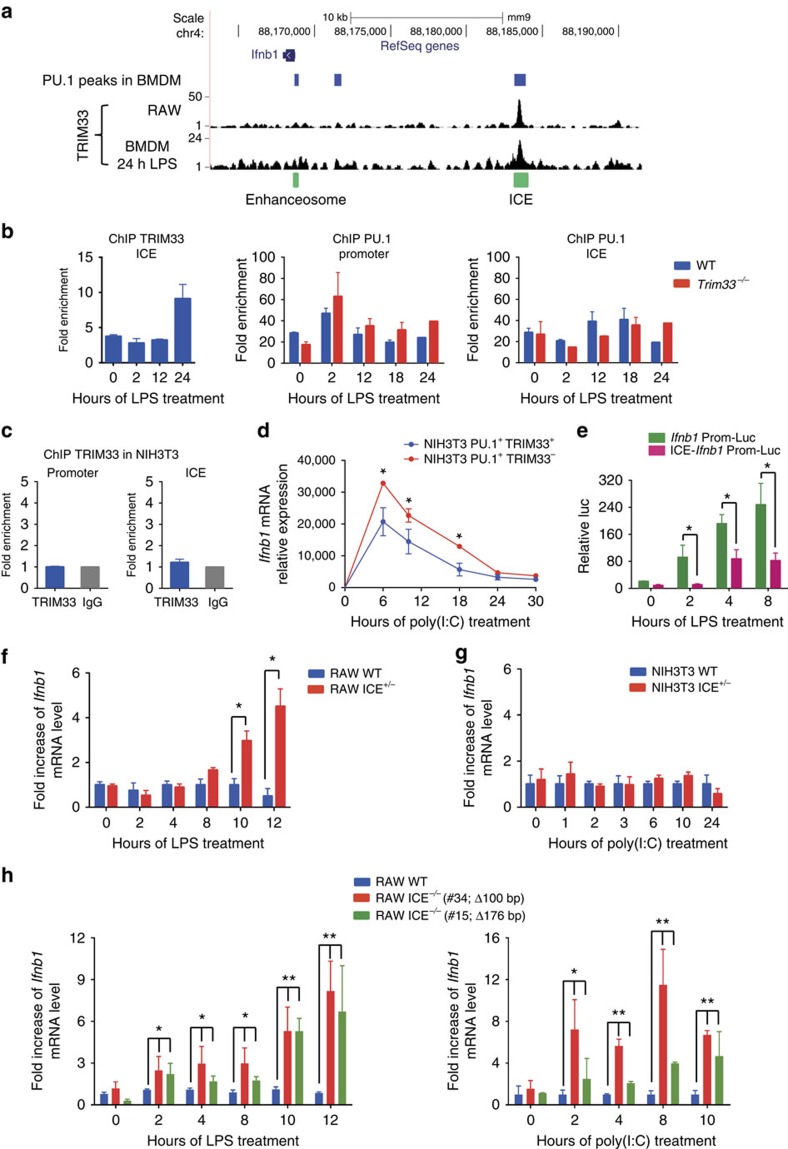
Figure 2. TRIM33 is bound to a distal Ifnb1 gene regulatory element (ICE) in macrophages.
(a) TRIM33 ChIP-seq data in RAW 264.7 cells and BMDM activated for 24 h with LPS showing TRIM33 binding to ICE, located 15 kb upstream the Ifnb1 TSS. Blue boxes indicate PU.1 peaks in BMDM (data from ref. 43). Green boxes indicate positions of ICE and the enhanceosome. (b) ChIP-qPCR data for TRIM33 binding on ICE in WT BMDM (left panel) and for PU.1 binding on Ifnb1 promoter and on ICE (right panels) in WT and Trim33−/− BMDM at indicated time points after LPS activation. Data represent the enrichment over a negative control region in the β-globin promoter. Mean±s.e.m., n=3. (c) ChIP-qPCR analysis of TRIM33 binding at the Ifnb1 promoter and on ICE in NIH3T3 cells. Mean±s.e.m., n=3. (d) Kinetics of Ifnb1 mRNA levels in NIH3T3 cells expressing PU.1 and a shRNA targeting Trim33 (NIH3T3 PU.1+ TRIM33−) or PU.1 and an shRNA targeting luciferase (NIH3T3 PU.1+ TRIM33+) and activated with poly(I:C). Mean±s.e.m., n=2. (e) Luciferase reporter assay in RAW 264.7 cells transfected with reporter constructs containing the Ifnb1 promoter alone (Ifnb1 Prom-luc) or ICE cloned upstream of the Ifnb1 promoter (ICE-Ifnb1 Prom-Luc) and activated with LPS. Mean±s.e.m., n=3. (f,g) Fold increase of Ifnb1 mRNA levels in ICE+/− versus WT RAW 264.7 cells after LPS activation (f) and in ICE+/− versus WT NIH3T3 cells after poly(I:C) activation (g). Mean±s.e.m., n=3. (h) Fold increase of Ifnb1 mRNA in ICE−/− versus WT RAW 264.7 cells after LPS (left) or poly(I:C) (right) activation. Mean±s.e.m., n=3 to 5. Clones carrying different deletions at the PU.1/TRIM33 site in ICE are indicated in brackets. *P<0.05 and **P<0.01, Mann–Whitney test.

