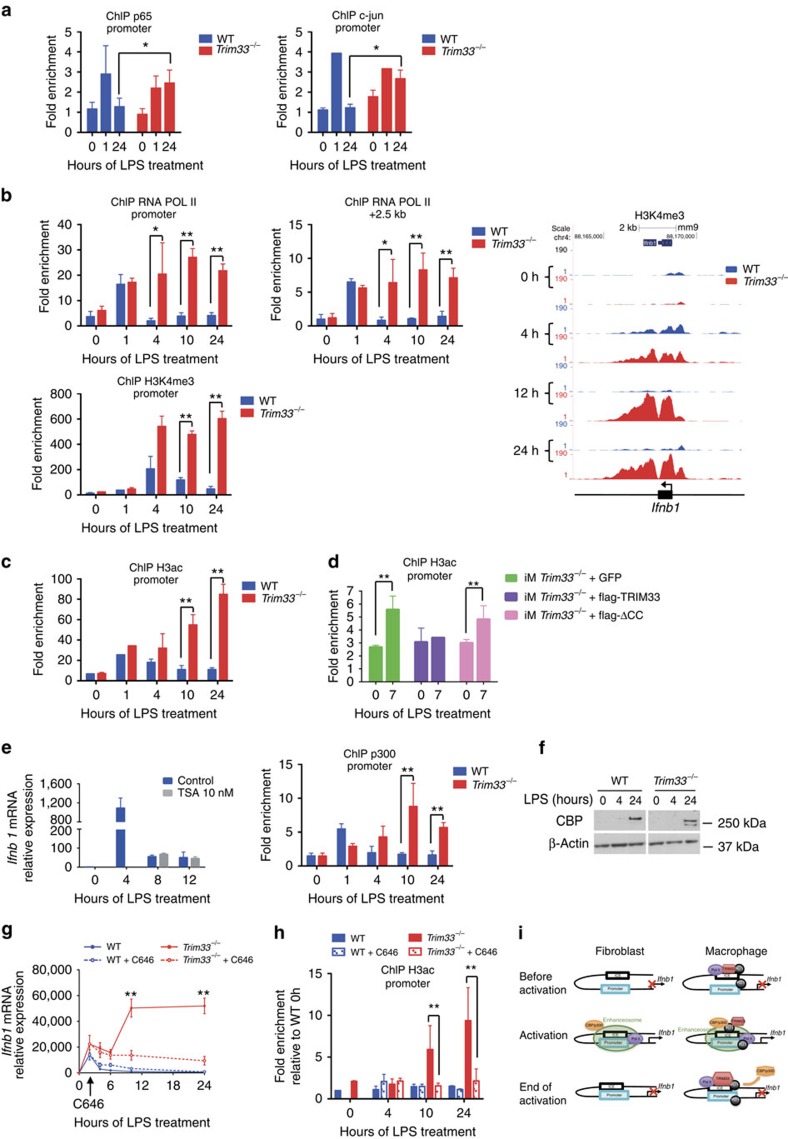
Figure 4. TRIM33 regulates Ifnb1 gene expression through inhibition of CBP/p300 recruitment.
(a) ChIP-qPCR of p65 (left panel) and c-jun (right panel) at the Ifnb1 promoter in WT and Trim33−/− BMDM treated with LPS. Mean±s.e.m., n=2 to 4. (b, top) ChIP-qPCR of RNA Pol II at the Ifnb1 promoter (left panel) and at a region located +2.5 kb from TSS (middle panel) in WT and Trim33−/− BMDM treated with LPS. Mean±s.e.m., n=3 to 5. (Bottom) ChIP-qPCR (left panel) and ChIP-seq (right panel) of H3K4me3 at the Ifnb1 promoter in WT and Trim33−/− BMDM treated with LPS. Mean±s.e.m., n=3. (c) ChIP-qPCR of H3ac at the Ifnb1 promoter in WT and Trim33−/− BMDM treated with LPS. Mean±s.e.m., n=4. (d) ChIP-qPCR of H3ac at the Ifnb1 promoter in Trim33−/− iM expressing GFP (iM Trim33−/− +GFP), full-length flag-TRIM33 and GFP (iM Trim33−/−+flag-TRIM33), or flag-TRIM33 lacking the coiled-coil domain and GFP (iM Trim33−/−+flag-ΔCC), and treated for 0 or 7 h with LPS. Mean±s.e.m., n=3. (e, left) Relative expression of Ifnb1 mRNA in LPS-activated WT BMDM in presence or absence of Tricostatin A (TSA), added 4 h after LPS stimulation. Mean±s.e.m., n=3. (Right) ChIP-qPCR of CBP/p300 binding at the Ifnb1 promoter in WT and Trim33−/− BMDM treated with LPS. Mean±s.e.m., n=4. (f) Western blot of CBP in WT and Trim33−/− BMDM treated with LPS. β-actin is shown as control. n=4 independent experiments. (g) Kinetics of Ifnb1 mRNA levels in LPS-activated WT and Trim33−/− BMDM, in the presence (dotted lines) or absence (continuous lines) of C646. C646 was added 2 h after LPS stimulation and Ifnb1 mRNA levels were determined. Mean±s.e.m., n=8. (h) ChIP-qPCR of H3ac at the Ifnb1 promoter in LPS-activated WT and Trim33−/− BMDM, in the presence (hatched columns) or absence (solid columns) of C646. Data are presented relative to H3ac binding in untreated WT BMDM. Mean±s.e.m., n=2. (i) Schematic representation depicting the role of TRIM33 in the macrophage-restricted Ifnb1 gene transcription shut down. *P<0.05 and **P<0.01, Mann–Whitney test.

