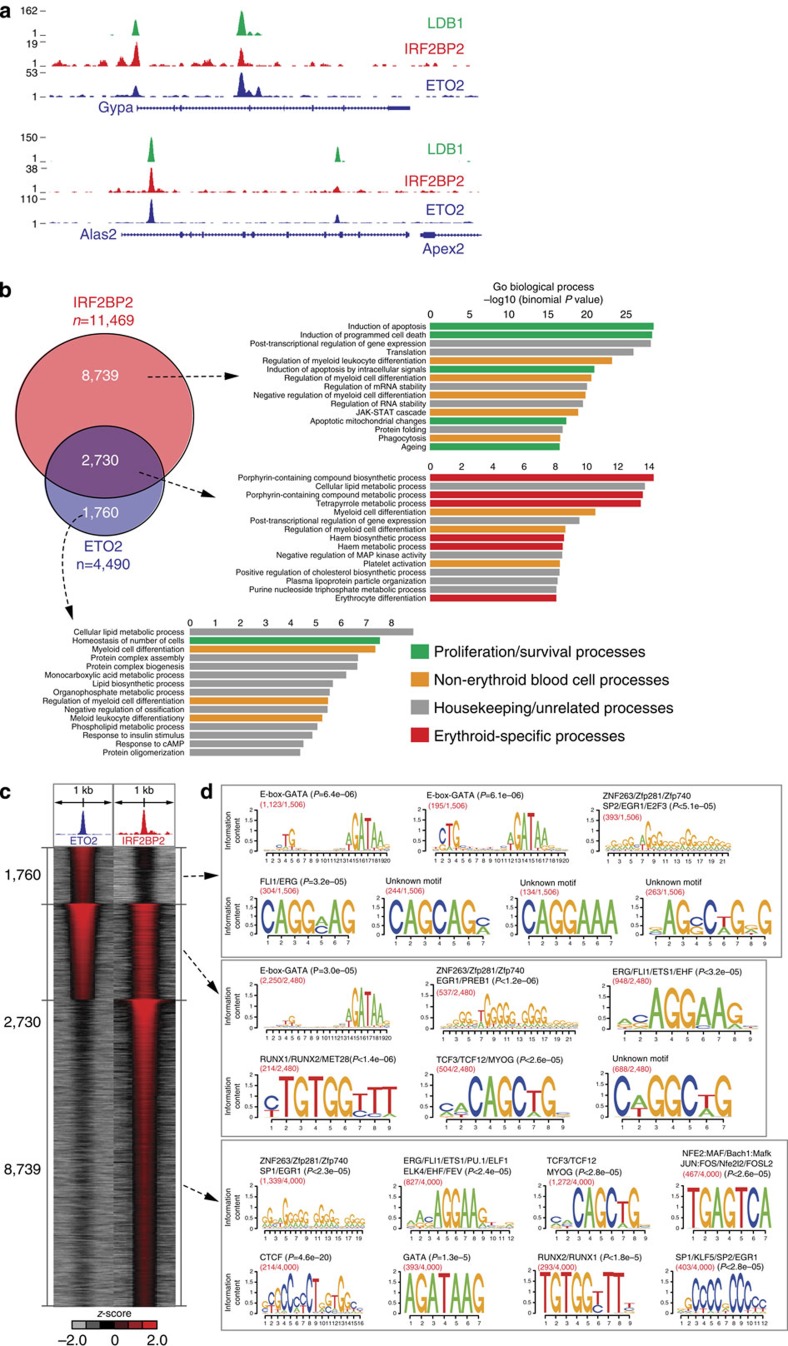
Figure 3. ETO2–IRF2BP2 genomic co-occupancy is associated with genes involved in key erythroid processes.
(a) Selected examples of overlapping ChIP-Seq profiles for LDB1, IRF2BP2 and ETO2 in MEL cells on key erythroid gene loci. (b) Venn diagram showing the genome-wide overlap between ETO2- and IRF2BP2-binding sites in MEL cells. GREAT analysis31 (see Methods for more details) was performed for each group of binding sites (ETO2 only, co-occupied and IRF2BP2 only) to identify their putative target genes and possible significantly associated Gene Ontology (GO) terms. The top 15 GO terms are shown for each group of binding sites, and individual GO terms were categorized into four classes (erythroid-related, non-erythroid blood-related, proliferation/survival-related and housekeeping/unrelated). (c) Heatmap visualization of ETO2 and IRF2BP2 ChIP-Seq data, depicting all significant binding events centred on the peak region within a 1-kb window around the peak (binding sites were ranked on intensity). (d) A motif analysis (see Methods for more details) on the three groups of binding sites (ETO2 only, co-occupied and IRF2BP2 only) was performed to identify possible over-represented transcription factor-binding motifs within the peak sequences. Red numbers denote (number of motifs)/(total number of binding sites).

