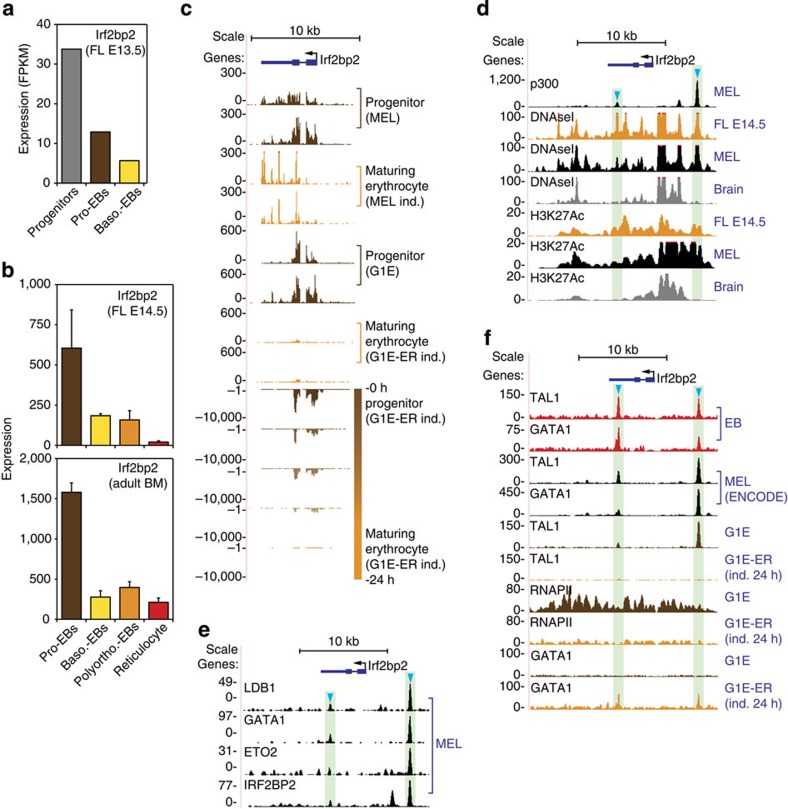
Figure 4. Irf2bp2 gene expression and transcriptional regulation during erythroid development.
(a) Irf2bp2 expression levels at different stages of erythroid development (‘Progenitors', CD71−/Ter119−; ‘Pro-EBs', CD71+/Ter119−; ‘Baso-EBs, CD71+/Ter119+) as determined by RNA-Seq analysis of sorted E13.5 fetal liver (FL) cells (n=1). (b) Irf2bp2 gene expression values at different stages of erythroid development in E14.5 FL and adult bone marrow (BM). Data were obtained from the online ErythronDB database35 (n=5, error bars denote s.d.). (c–f) Genome-wide data sets centred on the Irf2bp2 locus from MEL, G1E(-ER), E14.5 FL, erythroblast (EB) and whole-brain cells. (c) RNA-Seq data from (differentiating) erythroid progenitors. (d) ChIP-Seq (p300 and H3K27Ac, both associated with enhancer activity) and DNase I-Seq (denotes regions of open chromatin) tracks; note the presence of two erythroid-specific putative enhancer elements (blue arrowheads). (e) LDB1 complex (including IRF2BP2) occupancy of these putative enhancer elements in MEL cells. (f) GATA1, TAL1 and RNAPII binding to the Irf2bp2 locus in erythroid cells. Note the loss of TAL1 binding to the putative enhancer elements in differentiating G1E-ER cells, accompanied by a loss of RNAPII enrichments. Data shown in c,d and f were obtained from the ENCODE consortium36 (see Methods for details). Pro-EBs, pro-erythroblasts; Baso-EBs, basophilic erythroblasts; Polyortho-EBs, polyorthochromatic erythroblasts; RNAPII, RNA polymerase II.

