Fig. 2.

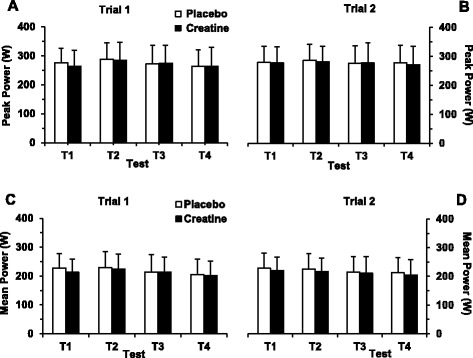
Peak power (a, b) and mean power (c, d) attained during upper-body intermittent sprint performance tests T1–T4 before (trial 1) and after (trial 2) 5-day supplementation period. The columns represents average ± SD peak and mean power values for six 15-s bouts of maximal effort performed during the test. In both placebo and creatine groups the number of subjects is 10
