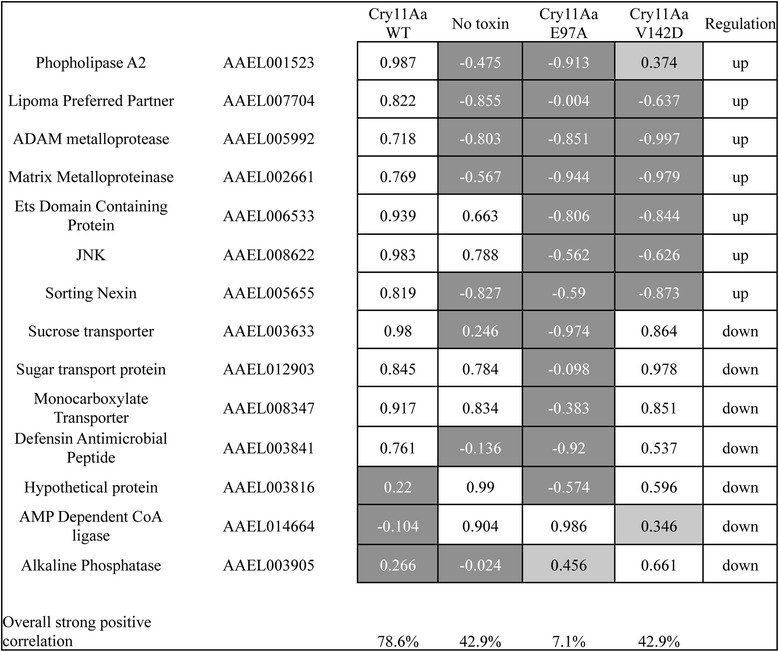
Fig. 4.

RNAseq and RT-qPCR correlation. Transcript abundance ratios were determined for each gene by SYBR Green RT-qPCR on a biological replicate of a 12 h Cry11Aa exposure curve, a control curve of non-toxin exposed A. aegypti larvae, or larvae exposed to non-lethal Cry11Aa mutants. Spearman correlation was determined between corresponding RNAseq values and log2 transformed abundance ratios. Strong positive correlations (above 0.5) are colored in white, weak positive correlation (between 0.3 and 0.5) are colored in light gray, and low, negative or no correlation values are colored in dark gray. Genes are indicated to be up regulated or down regulated as determined by RNAseq analysis. The percentage of genes with strong positive correlation between each curve and RNAseq data is shown
