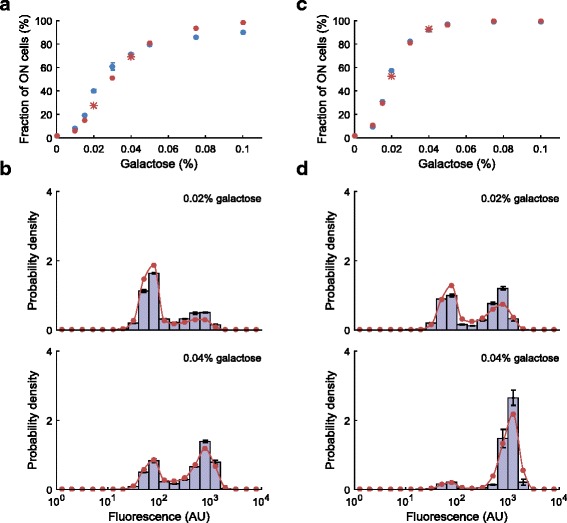
Fig. 4.

The predictive power of the model. a, c, Fraction of ON cells as a function of galactose concentration for 5-h (a) and 22-h (c) experiments: experimental (blue dots) vs. fitted (red dots) and predicted (red stars). Error bars represent SEM. b, d, Single-cell fluorescence distributions of S. cerevisiae with a PGAL1-YFP reporter are measured at two additional galactose concentrations (0.02 % and 0.04 %) after 5 h (b) and 22 h (d) of induction and compared against predictions from the model fitted without these data. Bars represent experimental measurements; error bars represent SEM. The model predictions without any fitting are in red
