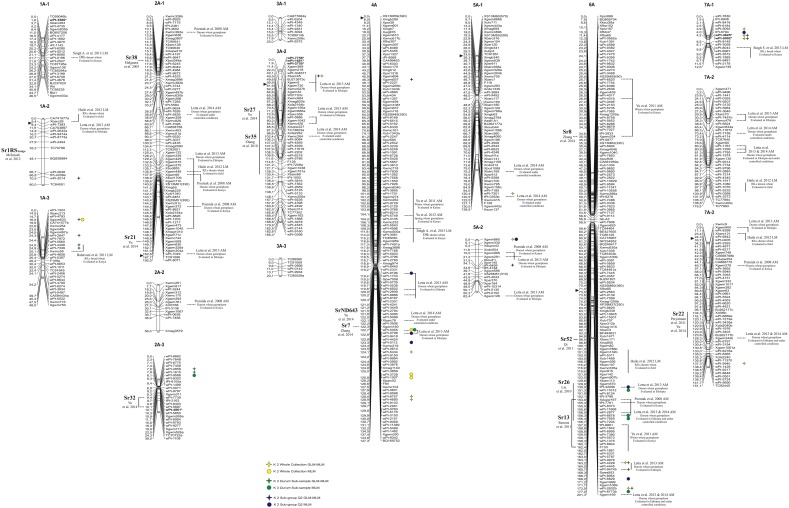
Figure 1.
Durum wheat consensus linkage map (genome A—reported in Marone et al., 2012b) with the genetic positions of markers significantly associated with resistance to stem rust race TTKSK at seedling stage in the whole collection (yellow), in the durum subsample (green), and in the Q2 group (blue). Right: circles, MTAs identified with the MLM; stars, MTAs identified in both GLM and MLM; the markers in bold and with an asterisk indicate MTAs that have been projected on the durum wheat consensus map.

