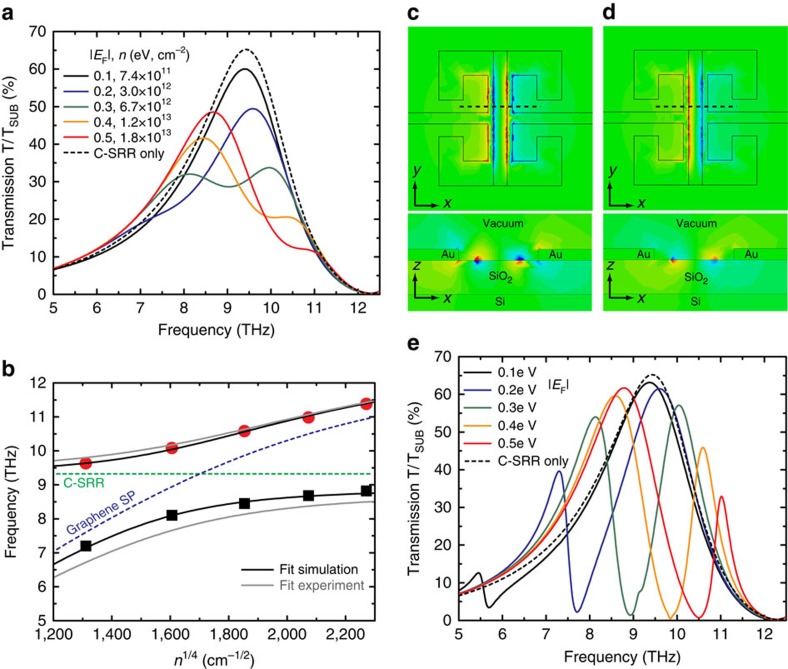
Figure 4. Simulated spectral response of C-SRR-GR hybrid metamaterials operating at ∼10 THz.
(a) Simulated transmission spectra of the C-SRR-GR hybrid metamaterial HM1 at various graphene Fermi energies (carrier densities) in comparison with that of a reference bare C-SRR array. The carrier relaxation time of 50 fs is used in this simulation. (b) Symbols are the extracted peak frequencies of the two hybridized modes in a as a function of the graphene carrier density (n1/4). The solid black curves are fits of the data points using equation (1), with the dashed lines of the same meaning as in Fig. 3c. The fits of the corresponding experimental data shown in Fig. 3c are also plotted in solid grey curves for comparison. (c,d) Simulated z-component of the E-field distributions associated with the two hybridized modes (transmission peaks), that is, the bonding mode (c) and the anti-bonding mode (d), at |EF|=0.3 eV. The upper graphs correspond to the field distributions in the x–y-plane right below the C-SRR-GR unit cell, and the lower graphs correspond to those in the x–z-plane indicated by the dashed line in the upper graphs. (e) Simulated carrier-density-dependent transmission spectra of a C-SRR-GR hybrid metamaterial in comparison with that of a reference bare C-SRR array, assuming 1 ps for the graphene carrier relaxation time.

