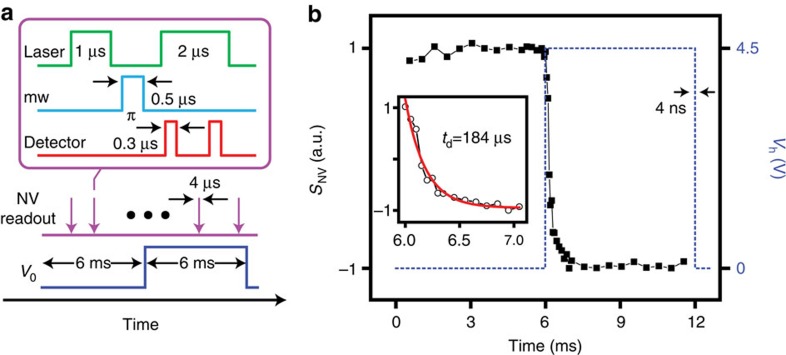
Figure 5. Probing time-dependent thermal processes.
(a) Pulse sequence. We induce a temperature transient in the tip by applying a sharp (4 ns rise/decay time) voltage pulse across the thermal cantilever. We monitor the tip temperature by reading the NV spin state at different points during the application of the voltage pulse (purple arrows). The readout protocol (upper square) relies on the fluorescence collected upon NV initialization (1 μs laser pulse) and application of a selective π-pulse (0.5 μs of mw) resonant with the NV mS=0↔mS=1 transition at Th=436 K (corresponding to V0=4.5 V). The photo-detector is opened twice during the readout, the first time to collect the spin-dependent fluorescence (300 ns read) and the second one to acquire a reference (300 ns) after the NV re-pumps into mS=0. (b) NV response SNV (left vertical axis) as a function of time; the scale is normalized relative to the maximum NV fluorescence contrast. The signal goes from bright to dim as the voltage pulse (dashed blue line) reaches its maximum (right vertical axis) and the NV tunes to resonance with the mw pulse. The figure inset zooms on the NV signal transition around 6 ms; we find a time constant td=184 μs.

