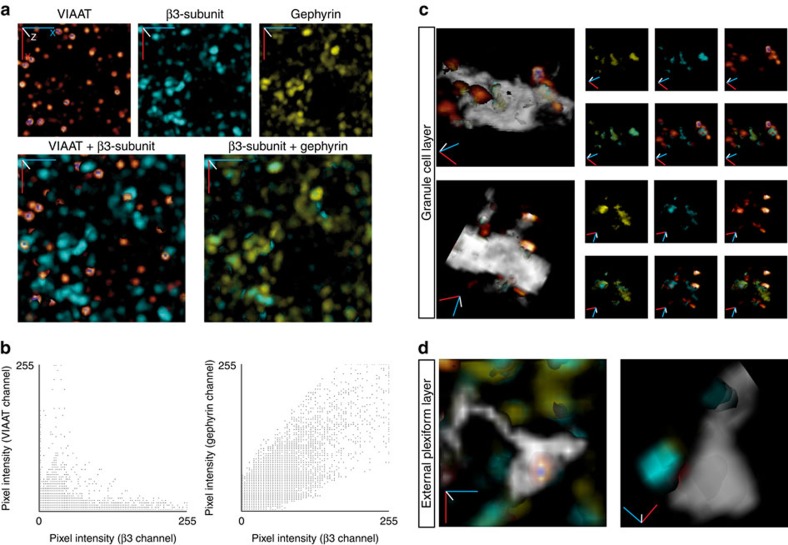
Figure 2. Synaptic localization of the β3-subunit, Gephyrin and GABA vesicles.
(a) 3D projections of the immunohistochemical detection of VIAAT (glow over palette), β3-subunit (cyan) and gephyrin (yellow) showing its distribution in the GCL (upper panels). The β3-subunit clusters colocalize with the gephyrin clusters, while VIAAT clusters directly oppose β3-subunit clusters (lower panels). The Cartesian coordinates x(blue), y (red) and z (white) are at the origin, but do not represent scale bars because of non-isotropic pixel size. The projections are representative of a small area in the GCL (20 μm × 20 μm, pixel size=0.114 μm) extended over 50 image frames (total z depth of 7.5 μm). Three independent experiments were performed. (b) Scatter plots generated by ImageJ colocalization finder plugin from immunolocalization data shown in a (representative example of three independent experiments). The analysis presented here covers 378 β3-clusters, 454 gephyrin clusters and 188 VIAAT clusters. (c) 3D reconstructions showing the granule cell membrane (grey) of the soma (upper panel) and a portion of the dendrite (lower panel) with superpositon of the β3-subunit, gephyrin and VIAAT clusters on the left (colour code as in a). The upper row of small panels shows the signal residing within the GC for gephyrin and β3-subunit and the surrounding VIAAT signal. The lower row of small panels shows the colocalization of β3-subunit with gephyrin (left) or VIAAT (centre) or all (right). The 3D reconstruction procedure is illustrated in Supplementary Figs 2 and 3. Cartesian axes x (blue), y (red) and z (white), image width ∼10 μm. (d) 3D reconstructions of GC gemmules with superpositon of β3-subunit, gephyrin and VIAAT clusters (colour code as in a). Note that VIAAT is inside the GC (transparent grey), while β3-subunit and gephyrin colocalize outside but close to the gemule. Cartesian axes x(blue), y (red) and z (white), image width ∼10 μm.

