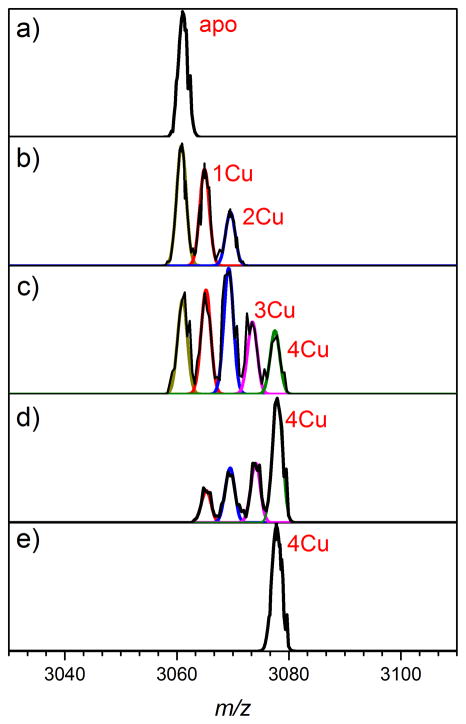
Figure 2.
Representative normalized mass-to-charge spectra of the 15+ charge state of CsoR as a function of copper addition. Solutions were 500 μM in CsoR protomer (125 μM tetramer) with the addition of 0 μM CuCl (a), 125 μM CuCl (b), 250 μM CuCl (c), 375 μM CuCl (d) or 500 μM CuCl (e). Each spectrum was fit with Gaussians at the mass– to–charge ratio of each Cu–bound state to determine the intensity (I) of each metallated species (apo; yellow, Cu1; red, Cu2; blue, Cu3; magenta, Cu4; green, left to right). Mol species fractions are calculated from Ii/ΣIi for each addition of Cu (see Figure 3).

