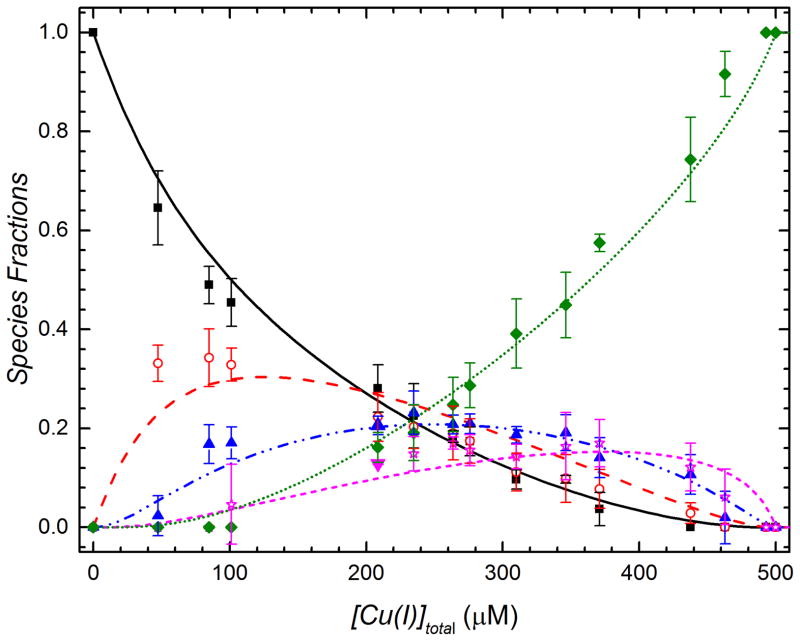
Figure 3.
Mol species fractions of CsoR tetramers as a function of Cu(I) concentration. Data represent triplicate experiments across all useable charge states, with standard error of the mean value defined by the error bar. The continuous lines are the results of a global fit of all species fractions as a function of added Cu(I) to a step-wise cooperative binding model (see Supporting Information). Apo, Cu1, Cu2, Cu3, Cu4 CsoRs species are represented by black squares, red open circles, blue triangles, magenta open stars and green diamond symbols, respectively.

