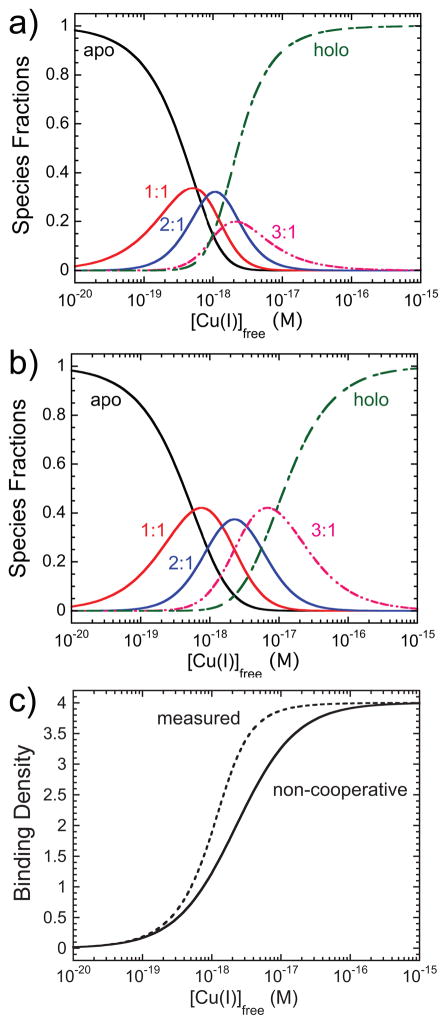
Figure 4.
Simulated species fractions vs. [Cu]free curves defined by the parameters resolved from the step-wise cooperative binding model (a) and a non-cooperative binding model (b) in which k=0.44 × 10¹⁸ M−1 (the fitted value from Ki (initial) of 1×10¹⁸ M−1 (see Table S1) (c) Cu-binding isotherms for the step-wise cooperative (dashed line; measured) and non-cooperative (solid line) binding models.

