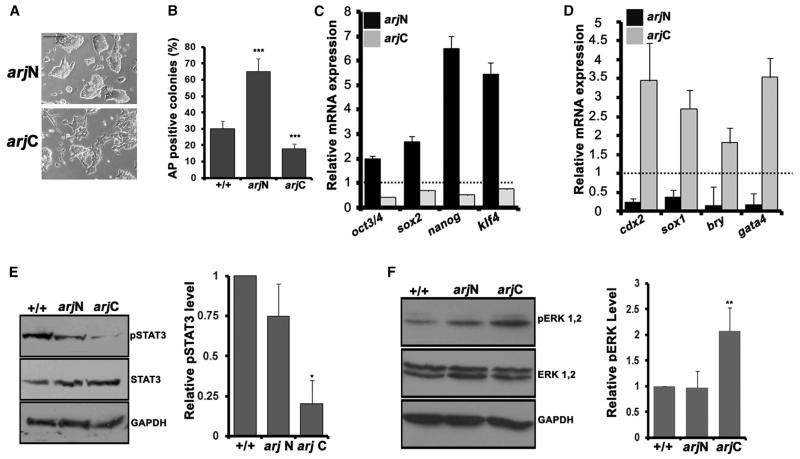
Figure 4. Overexpression of ArjC Reduces STAT3 Phosphorylation in ESCs.
Analysis of arjN and arjC ESC lines.
(A) Morphology.
(B) Graph showing AP+ colonies in a clonal assay.
(C and D) qRT-PCR analysis showing expression of pluripotency markers (C) and differentiation markers (D).
(E and F) Western blot and graphical representation showing the (E) pSTAT3 level and (F) pERK level. GAPDH was used as a normalizing control.
Statistical significance is indicated by *p < 0.02, **p < 0.05, ***p < 0.001. Error bars show SD of the mean. Scale bar, 10 μM. See also Figure S3.

