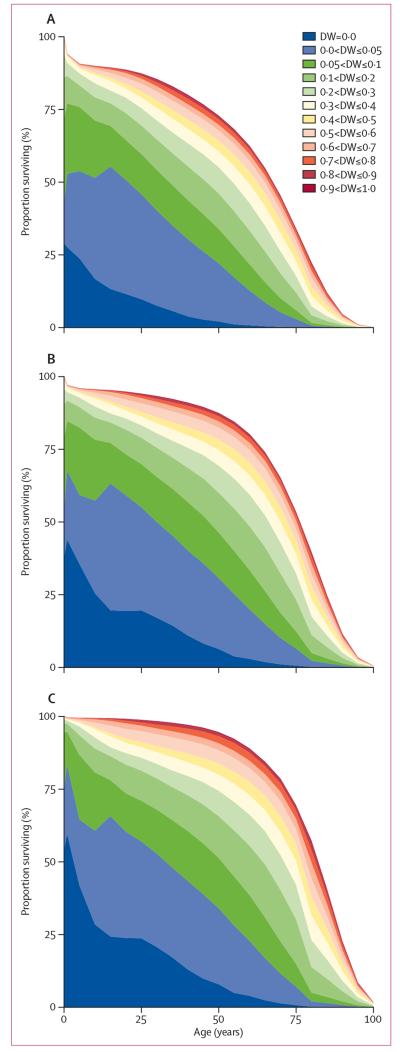
Figure 1. Survivorship curve stratified by disability weight in 2013.
Health survivorship function showing the fraction of a birth cohort alive at each age exposed to 2013 death rates, with the fraction of time spent at each age by the birth cohort decomposed by level of disability weight. Countries are grouped by socidemographic status into quintiles, including the lowest quintile (A), the three middle quintiles (B), and the highest quintile (C). DW=disability weight.

