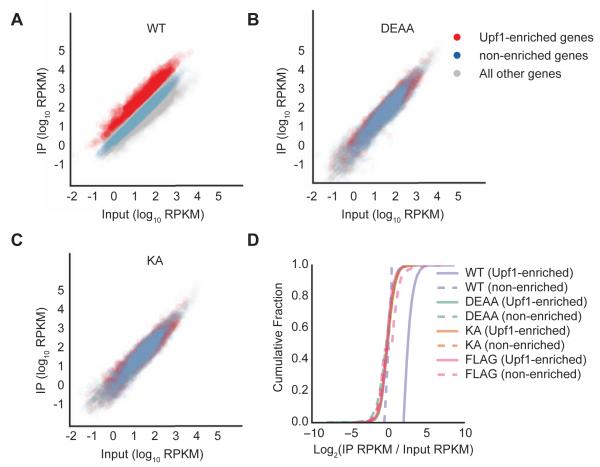
Figure 2. Transcriptome-wide loss in mRNA selectivity for Upf1 ATPase cycle mutants.
(A-C) Scatter plots of reads per kilobase transcript per million mapped reads (RPKM) from RNA-seq of input samples versus IPs for Flag-Upf1 WT (A), DEAA (B) and KA (C). Genes with IP/input ratios for WT Upf1 of greater than 2.05 (cut-off based on 5% false discovery rate (FDR) established using cells expressing Flag epitope only, Figure S2) are shown in red (Upf1-enriched), while genes with log2 (IP/input) between −0.5 and +0.5 are shown in blue (non-enriched). All remaining genes are shown in grey.
(D) Cumulative fraction of Upf1-enriched and non-enriched genes with IP enrichment represented as log2 (IP RPKM/input lysate RPKM) for Flag-Upf1 WT, KA, and DEAA, along with Flag only. Difference between WT Upf1 (Upf1-enriched) curve compared to all other curves was statistically significant (p-value <0.05 for all comparisons, KS-test).

