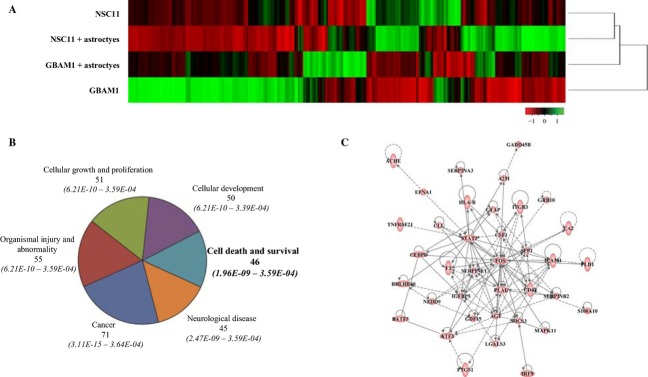
Figure 4.
The effect of astrocyte coculture on GSC gene expression. (A) Unsupervised hierarchical clustered heatmap of row-normalized z-score values comparing probesets of NSC11 and GBAM1 monocultures versus GSCs exposed to astrocytes for 48 h (P < 0.05). (B) Commonly increased genes from NSC11 and GBAM1 cocultures (P < 0.05 and an increase of ≥twofold) were subjected to IPA analysis with the top six biological functions (containing 45 or more genes) shown. (C) IPA derived interconnecting network formed by 37 of the 46 genes from the cell death and survival category. GSCs, glioblastoma stem-like cells; IPA, ingenuity pathway analysis.

