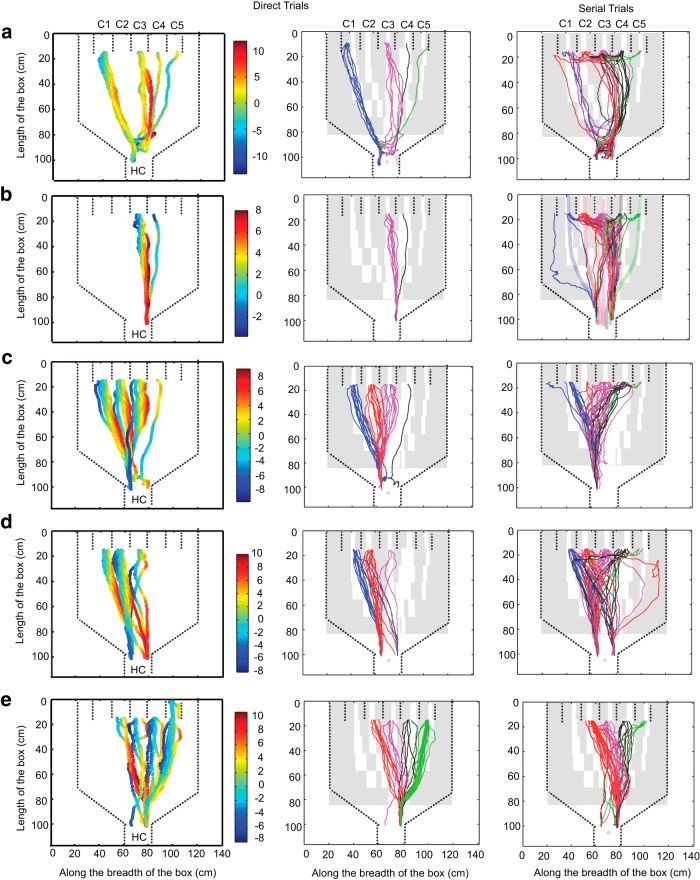
Figure 5.
Instantaneous deviation of trajectory from odor path for each rat. a–e, Deviation plotted for forward tracks only. Left column panels are deviations for direct trials for 1 d. Deviation values are plotted as color scale (cm). Central and right columns show examples of tracks for direct and serial trials respectively, overlaid on observed odor plumes from Figure 2c. Tracks are color-coded for each compartment: C1, blue; C2, red; C3, pink; C4, black; and C5, green. . Dashed lines represent boundaries of the box and the compartments. HC, Holding chamber; C1 to C5, compartment numbers 1 to 5.

