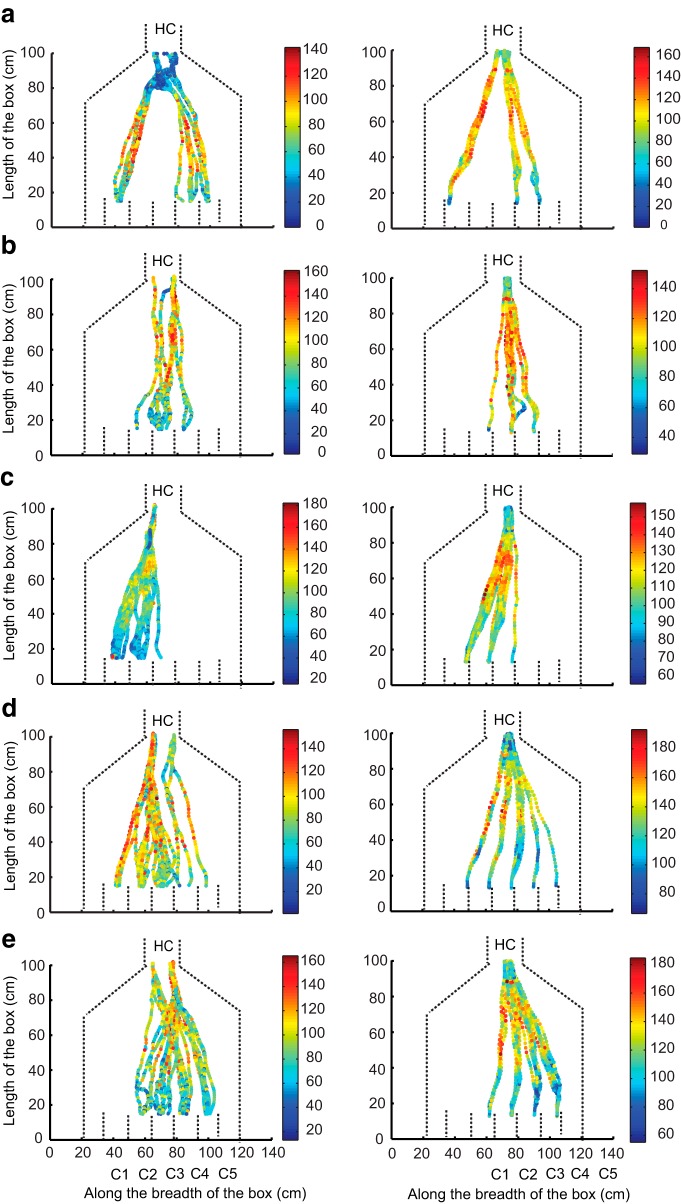
Figure 7.
Instantaneous speed for direct trials plotted for each rat. a–e, Left column shows the speeds plotted for forward direction. Right column shows the speeds in reverse direction. The color bars show the values of the speeds (in cm/s). x-Axis is the breadth of the box (in cm) and y-axis is length of the box (in cm). Dashed lines represent boundaries of the box and the compartments. HC, Holding Chamber; C1 to C5, compartment numbers 1 to 5. The plots show multiple trials for a single day.

