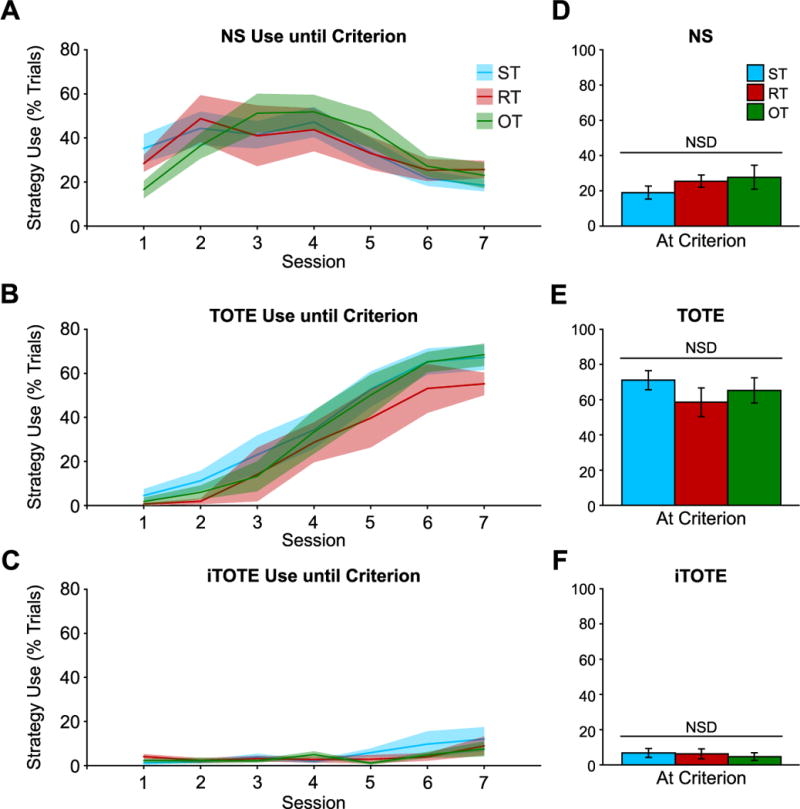
Fig.6.

Strategy use over days leading up to criterion. Strategy use changed in a consistent way during training and all groups showed the same dynamics. (A) NS use was used more frequently than either TOTE or iTOTE during early training sessions (1–3) after which point NS use began to decline and TOTE use increased markedly and was more frequent than NS or iTOTE in sessions leading up to criterion (6–7) (B). All groups used NS (D), TOTE (E) and iTOTE (F) in equal amounts at criterion. Solid lines in A–C depict mean while shaded area depicts ± sem. Bars in D–F depict mean ± sem.
