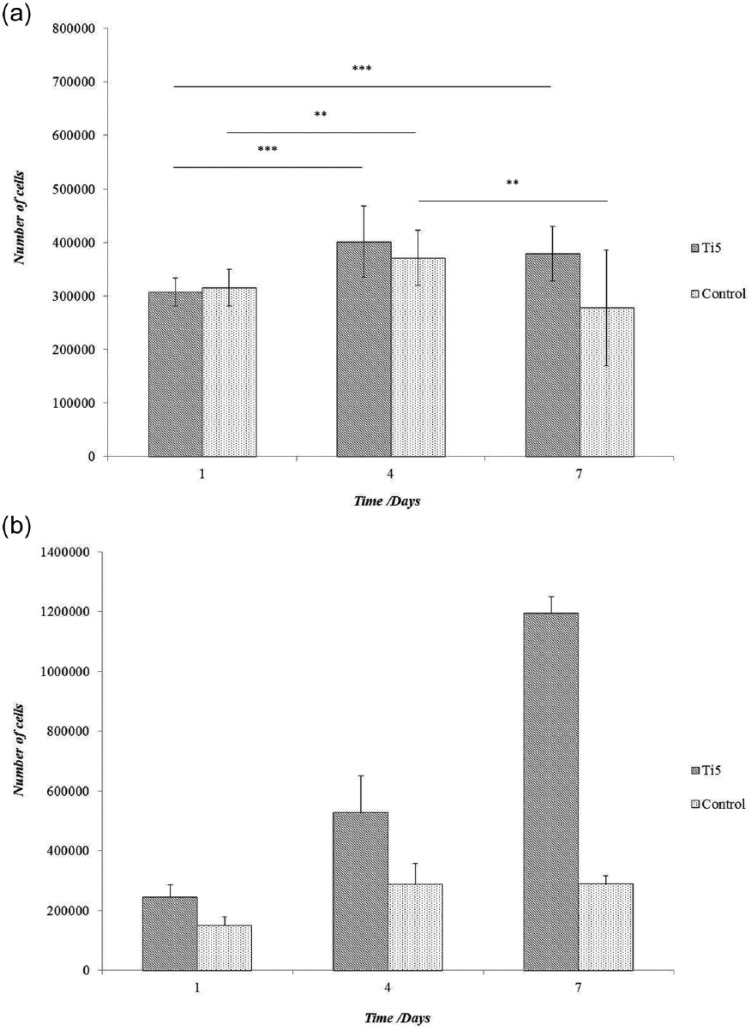
Figure 1.
Bar charts showing the proliferation of MG63 cells on Ti5 and control glass microspheres at time points of 1, 4, and 7 days under (a) static conditions in ultra-low attachment plates and (b) under dynamic conditions in spinner flask bioreactors, as determined using the CCK-8 assay. The control comprises silica glass microspheres (Polysciences Inc.). Error bars represent ±SD where n = 2. ** and *** indicate p < 0.01 and p < 0.001, respectively (note that for clarity, statistical significance is not shown in graph (b)).

