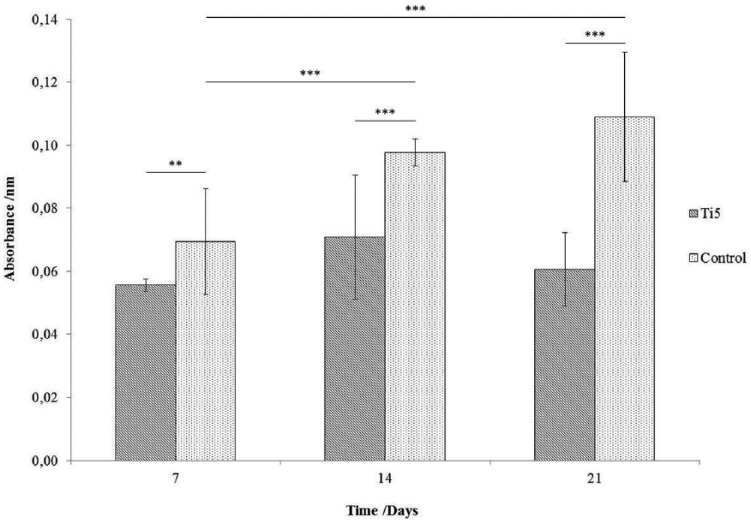
Figure 7.
Bar chart representing the differentiation of hMSCs in OM into bone cells on Ti5 and control glass microspheres as quantified by the extent of mineralization on the microsphere surface using an Alizarin Red S assay carried out at time points of 7, 14, and 21 days. Error bars represent ±SD where n = 2. ** and *** indicate p < 0.01 and p < 0.001, respectively.

