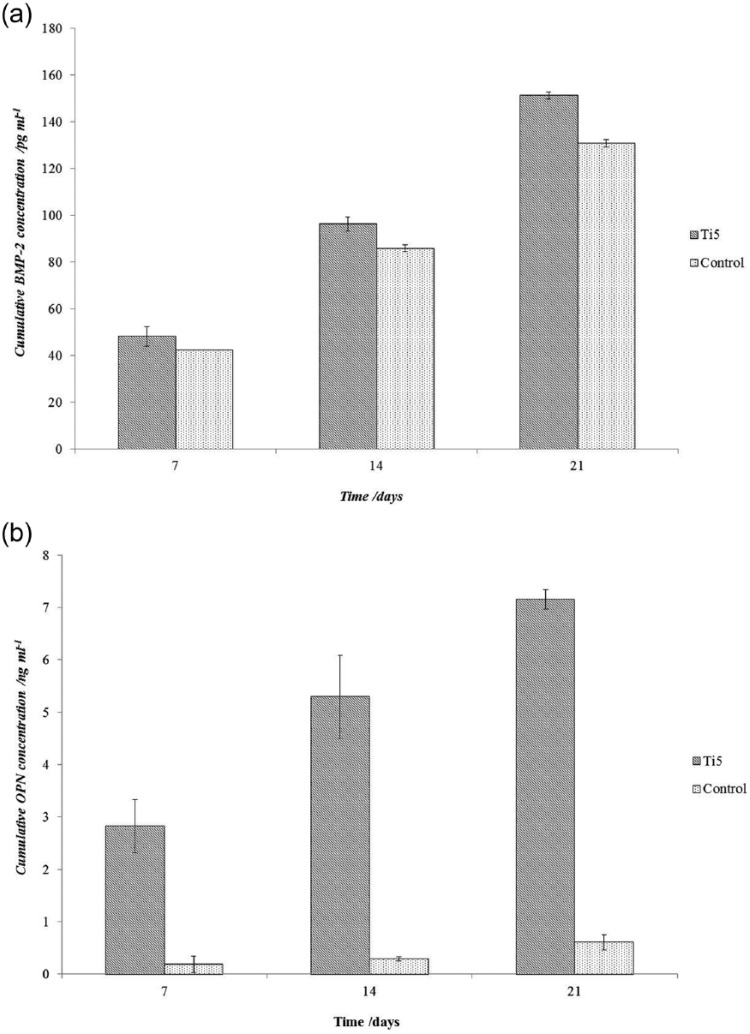
Figure 8.
Bar chart for hMSCs in OM showing the variation in the cumulative secretion of (a) bone morphogenetic protein-2 (BMP-2) and (b) osteopontin (OPN) by hMSCs at time points of 7, 14, and 21 days when cultured on Ti5 and control microspheres in osteogenic medium, as quantified using a mammalian BMP-2 ELISA. Error bars represent ±SD where n = 2.

