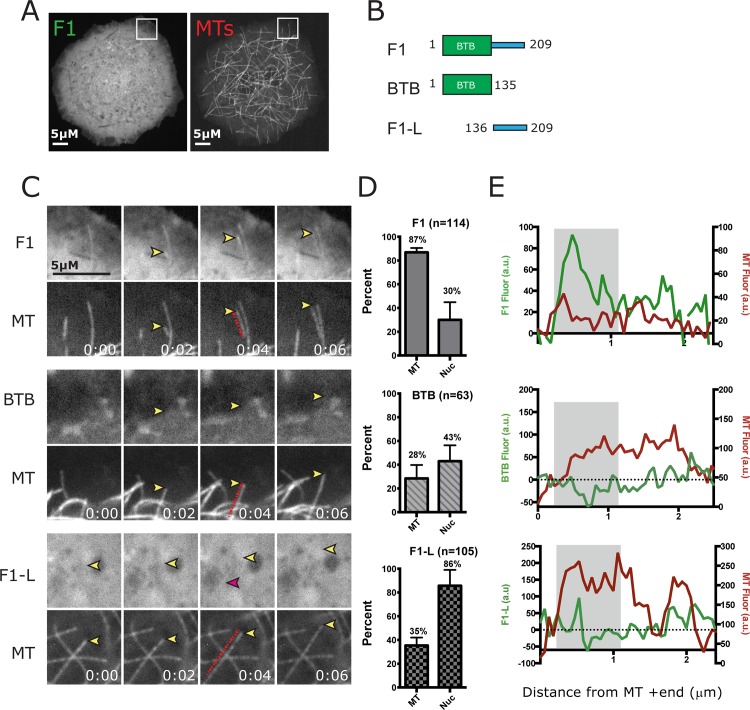
Fig 3. CP190-F1 is enriched at the plus ends of growing MTs.
A, Images of S2 cells expressing GFP-F1 and TagRFP-Tubulin. Box indicates inset for zoom in C. B, Schematic of the CP190-F1 sub-fragments F1, BTB and Linker domain (F1-L) analyzed for MT association. C, Live-cell imaging of F1 reveals enrichment at the plus end of MTs. Yellow arrowhead indicates a growing MT plus end. D, Graphs indicate percent of cells with MT and Nuclear localization. E, Graphs shown to the far right are line scans along the MTs indicated in frames 0:04 (red dashed line) in C. X-axes are arbitrary fluorescence units (a.u.) and y-axis is distance in microns from the MT +tip end (coordinate x = 0). F1 linescan indicates its enrichment at the MT +ends (grey area on graph). In contrast, the BTB domain and F1-L show very weak localization to some MTs (pink arrowhead, grey box on graph). Scale bars = 5μm. Time = min:s.

