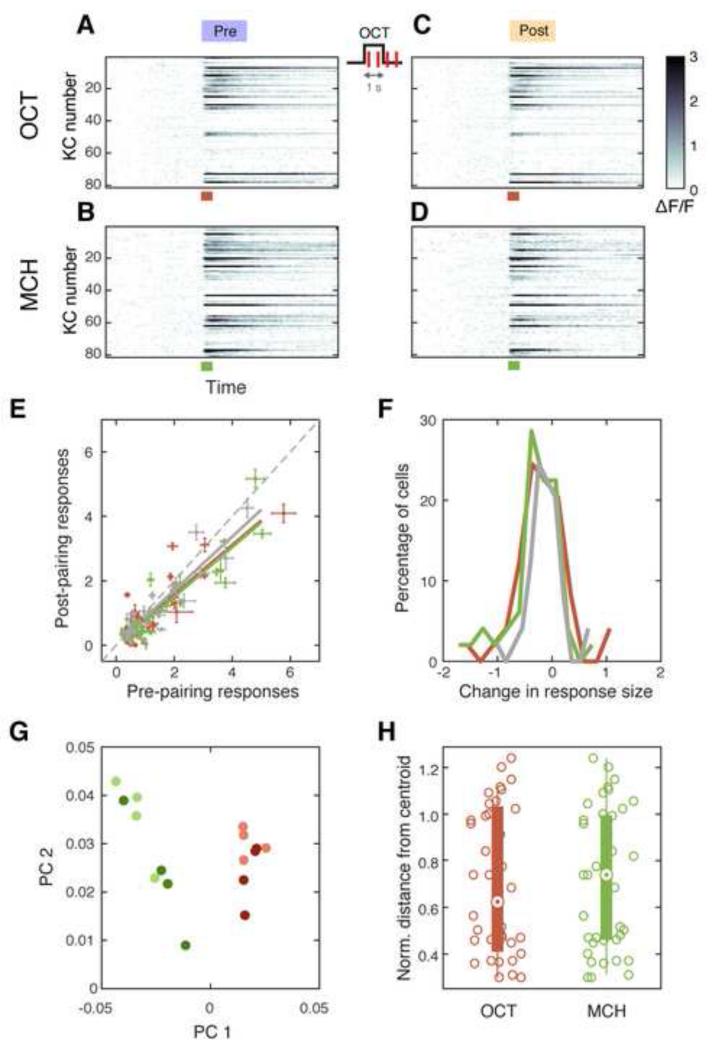
Figure 2. Odor-Dopamine Pairing does Not Change KC Odor Responses.
(A-D) Trial-averaged time courses (4 trials) of odor responses (ΔF/F, pseudo color) in KCs before (A, C) and after (B, D) 1-s odor-light pairing. Data from a single representative fly. Each row corresponds to a single KC. Colored bars, 1-s odor presentation.
(E) Median response amplitude for each significantly responding cell before and after pairing. Red and green points indicate CS+ (OCT; n = 53 cells from 5 flies) and CS− (MCH; n = 49) respectively. Gray points are from control experiments where no light pulses were delivered (OCT and MCH; n = 32 from 2 flies). Error bar, median absolute deviation. Solid lines, linear regressions. Dashed line, unity. All three data set showed small but significant decrease after pairing (p < 0.05, paired t-test).
(F) Histograms of the change in response magnitude (ΔF/F) after pairing (pre subtracted from post). Only cells that significantly responded to the odor in either pre- or post-pairing recordings were included. There was no difference between any combination of the distributions of CS+ responses (red), CS− (green) and control (gray; Kolmogorov Smirnov test, p > 0.1).
(G) Single-trial responses projected onto the space of the first two principal components. Data from a single representative fly. Responses from pre- (lighter colors) and post-pairing trials (darker colors) are intermingled, while CS+ (red) and CS− (green) are well-separated.
(H) Comparing population response patterns pre- and post-training. Euclidean distances between each post-pairing trial and the centroid of pre-pairing trials calculated in the full n-dimensional neuronal representation space are plotted, where n corresponds to the number of neurons imaged in each fly. Distances were normalized to the distance from the origin to the centroid of the pre-pairing trials. There was no significant difference between CS+ (red) and CS− (green; p = 0.58, unpaired t-test). See also Experimental Procedures.

