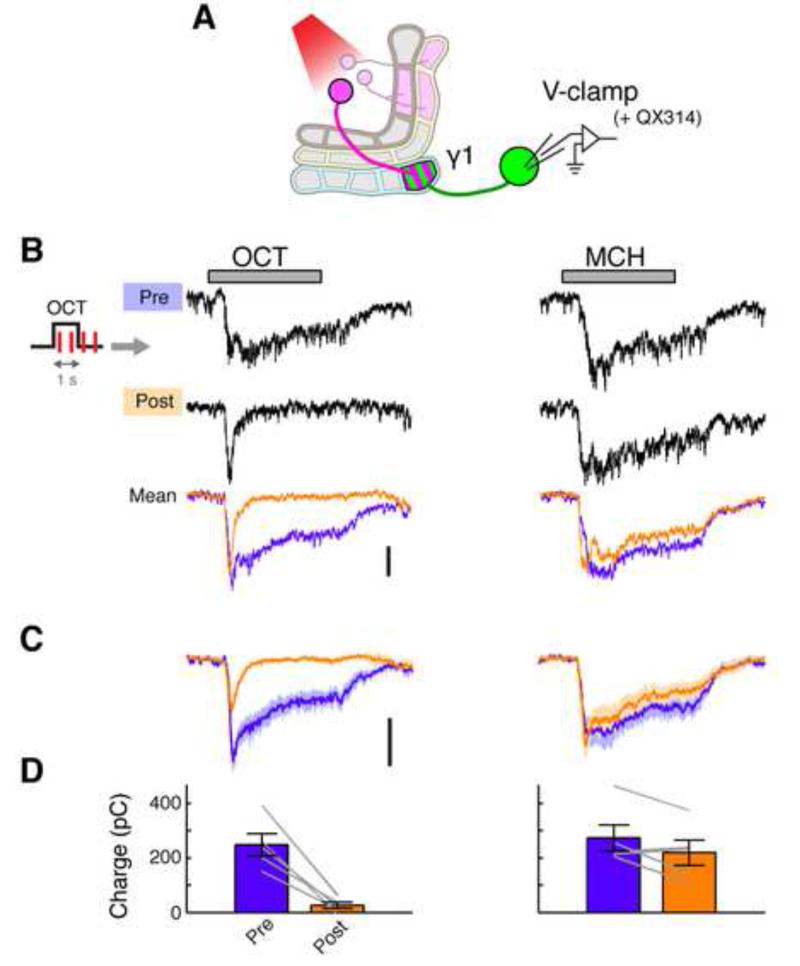
Figure 3. Pairing of Odor and DAN Activation Induces Synaptic LTD.
(A) Expression of CsChrimson and GFP was driven by MB320C and R12G04-LexA, respectively. Whole-cell voltage-clamp recordings were made from MBON-γ1pedc. Action potentials were completely suppressed by QX-314 in the pipette solution.
(B) Representative voltage-clamp data from a single cell, showing odor-evoked EPSCs before (Pre) and after (Post) pairing. Gray bar, 1-s odor presentation. Overlaid traces (bottom) show mean EPSCs pre- and post-pairing in this cell (n = 5-7 trials). Scale bar, 200 pA.
(C) Mean EPSCs (± SEM, shaded area; n = 5 cells).
(D) Mean charge transfer of EPSC (± SEM). Gray lines indicate data from individual flies. Excitatory synaptic input decreased for CS+ (p < 0.005, Tukey’s post hoc test following repeated measures two-way ANOVA) but not for CS− (p > 0.1).

