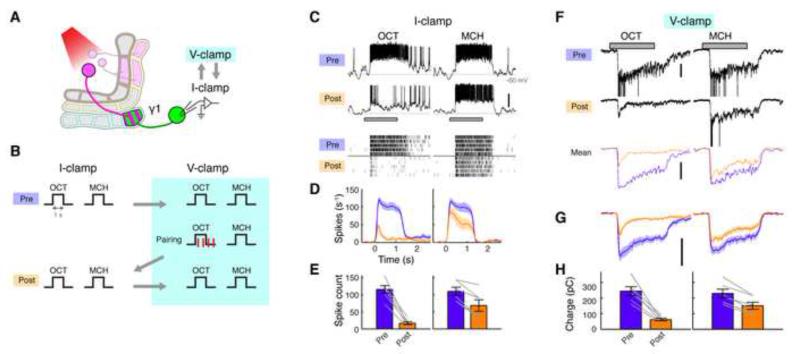
Figure 4. Postsynaptic Spikes are Dispensable for LTD Induction.
(A) Expression of CsChrimson and GFP was driven by MB320C and R12G04-LexA, respectively. Whole-cell recordings were made from MBON-γ1pedc.
(B) After recording baseline odor responses in current-clamp mode, recording mode was switched to voltage clamp to record EPSCs. Odor-light pairing (1-s odor with 1-ms light pulses × 4) was performed under voltage-clamp mode, which suppressed 83 ± 4.5 % of odor-evoked spikes (mean ± SEM, n = 6). After pairing, spikes and EPSCs were recorded by flipping the mode between current-clamp and voltage-clamp.
(C) Representative current-clamp data from a single cell, showing odor responses before (Pre) and after (Post) pairing. Gray bar, 1-s odor presentation. Scale bar, 20 mV. Raster plots (bottom) show spikes.
(D) Mean PSTH (± SEM, shaded area; n = 6).
(E) Mean odor-evoked spike count (± SEM). Gray lines indicate data from individual flies. Spike counts decreased in both CS+ (p < 0.001, Tukey’s post hoc test) and CS− (p < 0.01), but the effect of pairing was significantly different between the two odors (p < 0.005, repeated measures two-way ANOVA).
(F) Representative voltage-clamp data from the same cell shown in (C). Currents evoked by unclamped spikes were truncated for display. Mean EPSCs (3 trials) after filtering out unclamped spikes are also shown (bottom). Scale bar, 200 pA.
(G) Mean filtered EPSCs (± SEM, shaded area; n = 6).
(H) Mean charge transfer (± SEM). Gray lines indicate data from individual flies. Charge transfer decreased in CS+ (p < 0.001, Tukey’s post hoc test) and CS− (p < 0.001), but the effect of pairing was significantly different between the two odors (p < 0.005, repeated measures two-way ANOVA).

