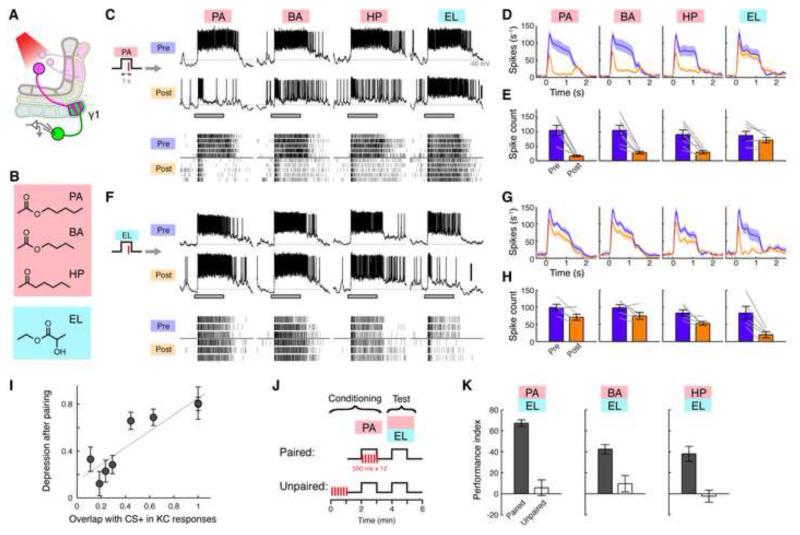
Figure 7. Synaptic Interference and Olfactory Generalization.
(A) Expression of CsChrimson and GFP was driven by MB320C and R12G04-LexA, respectively. Recordings were made from MBON-γ1pedc.
(B) Chemical structures of the test odors. PA: pentyl acetate, BA: butyl acetate, HP: 2-heptanone, EL: ethyl lactate.
(C) Representative single-cell data, showing odor responses before (Pre) and after (Post) pairing with PA. Gray bar, 1-s odor presentation. Gray line, −60 mV. Scale bar, 20 mV. Raster plots (bottom) show spikes.
(D) Mean PSTH (± SEM, shaded area; n = 7).
(E) Mean odor-evoked spike count (± SEM). Gray lines indicate data from individual flies. Depression was significant for PA, BA and HP (p < 0.005, Tukey’s post hoc test following repeated measures two-way ANOVA) but not for EL (p > 0.1). Depression of PA was slightly stronger than BA and HP (p < 0.05, paired t-test).
(F) Representative single-cell data for pairing with EL.
(G) Mean PSTH (n = 5).
(H) Mean odor-evoked spike count. Depression was significant for EL (p < 0.01, Tukey’s post hoc test following repeated measures two-way ANOVA) and HP (p < 0.05) but not for the others (p > 0.05). Depression of EL was stronger than HP (p < 0.05, paired t-test).
(I) Magnitude of depression correlates with extent of overlap in KC response patterns (p < 0.005, Pearson’s r = 0.90). Each point shows the response depression for a different odor with the indicated degree of overlap with the CS+ KC response pattern (overlap calculated from data in Campbell et al., 2013). Error bars, SEM. Gray line, linear regression.
(J) Behavioral test for odor generalization. Flies were presented with PA and light in a paired or unpaired manner (see Figure S1) and subsequently tested for aversive learning with one of the three different combinations of odors.
(K) Performance index (PI). Positive PI indicates relative avoidance of PA, BA or HP when flies are given the choice between those odors and EL. Flies generalized their avoidance of PA to the other odors (n = 10 for each; p < 0.01, Tukey’s post hoc test following two-way ANOVA).

