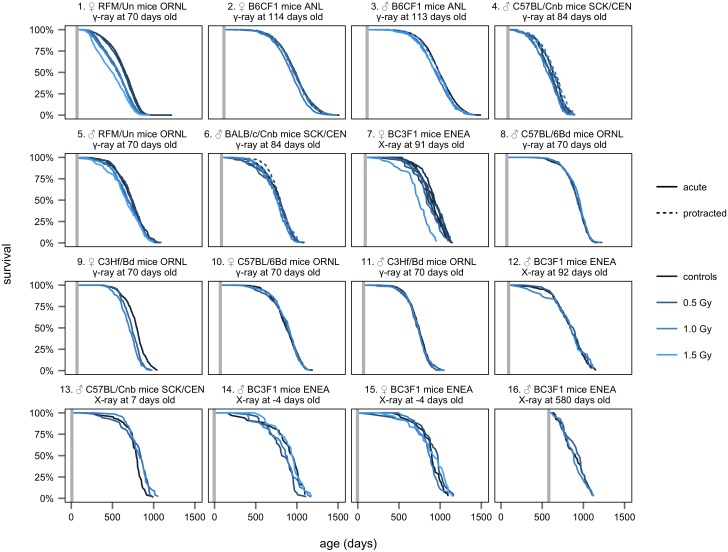
Fig 4. Survival vs. dose.
Kaplan-Meier survival curves based on individual animal data show the percent of surviving animals vs. age for each treatment group of the expanded animal data set used in this analysis. The color of each curve indicates total dose, from dark blue (unexposed controls) to light blue (up to 1.5 Gy). A solid line indicates acute exposures. A dashed line indicates fractionated exposures. A vertical gray line indicates age at first exposure. Treatments are stratified by sex, strain, type of radiation, and age at first exposure as labeled. The strata are presented in order of total number of animals included, so that the 1st strata on the top left has the most animals, 6977, and the 16th strata on the bottom right has the least, 126. This same ordering is maintained in all subsequent figures, as are the strata identifiers (e.g. strata labeled #2 always shows data from female B6CF1 ANL animals, 114 days old at the time of first exposure). Please note that the bottom row contains data from studies that investigated the effects of radiation exposure on very young (pre-natal and neonatal) and very old mice. In addition, note that the uppermost leftmost stratum contains data used in the original BEIR VII analysis. This is only the acute exposure data from that analysis, as the data from protracted exposures was not available for individual mice.

