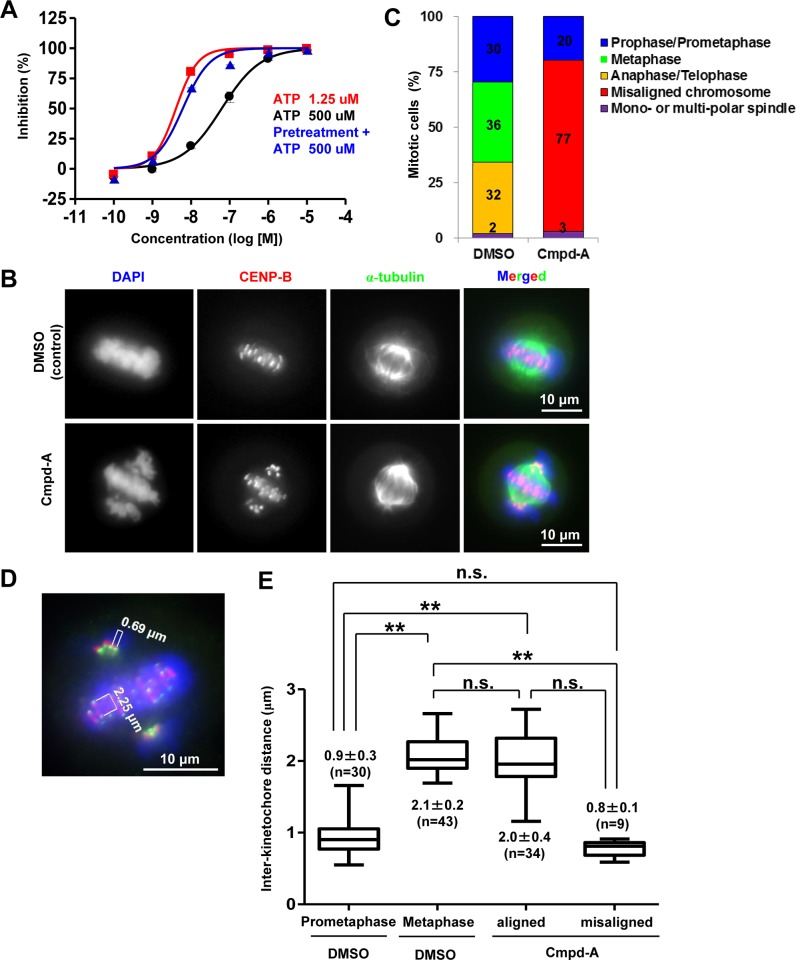
Fig 1. CENP-E inhibitor Cmpd-A induces chromosome misalignment during mitosis.
(A) Cmpd-A is a time-dependent inhibitor with an ATP competitive-like behavior. Red and black lines indicate the dose-dependent activity of Cmpd-A in the presence of low (1.25 μM) and high (500 μM) concentrations of ATP, respectively. The blue line indicates the activity of Cmpd-A with a high concentration of ATP, following 1 h of preincubation with CENP-E. The X-axis and Y-axis indicate the concentration of Cmpd-A and % inhibition of CENP-E ATPase activity, respectively. (B) Representative mitotic HeLa cells treated with Cmpd-A (200 nM) or DMSO. Arrows indicate misaligned chromosomes. Blue, green, and red signals indicate 4′,6-diamidino-2-phenylindole (DAPI)-stained DNA, α-tubulin, and CENP-B (kinetochores), respectively. (C) Quantitative analysis of mitotic morphology in the DMSO- or Cmpd-A-treated HeLa cells. The cells were treated for 3 h with 200 nM Cmpd-A or DMSO after dT block release. The DMSO- and Cmpd-A-treated mitotic cells (105 and 106 cells, respectively) were then counted. (D) Inter-kinetochore distance of aligned and misaligned chromosomes in HeLa cells treated with Cmpd-A or DMSO. Prometaphase (left) and metaphase (middle) cells were used as controls for misaligned and aligned chromosomes, respectively. The inter-kinetochore distance was measured between the outer kinetochore markers (HEC1) of individual chromosomes. Statistical analysis was performed using Student’s t-test. Differences were considered significant at P ≤ 0.05 (*) and P ≤ 0.01 (**).

