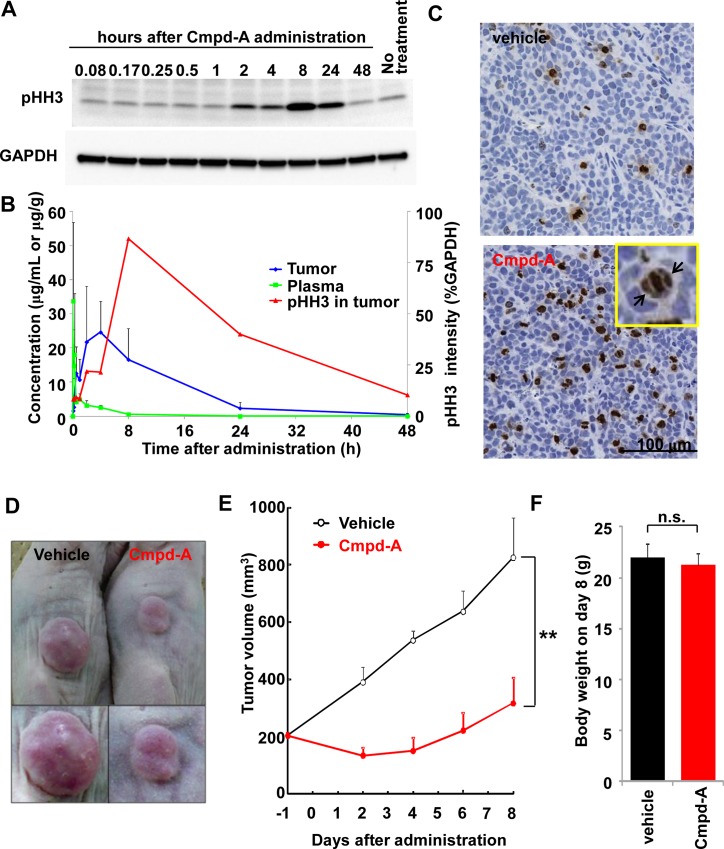
Fig 7. PK/PD and antitumor efficacy of Cmpd-A in a COLO205 xenograft nude mouse model.
(A) Expression of pHH3 in COLO205 xenografts at the indicated time points after the intraperitoneal administration of Cmpd-A at a dose of 100 mg/kg. (B) Time-dependent PK and PD of Cmpd-A. The green, blue, and red lines indicate plasma concentration, tumor concentration, and tumor pHH3 intensity, respectively. The pHH3 intensity was quantified using the results shown in (A). (C) Immunohistochemistry of pHH3 in the tumor sections from COLO205 xenograft nude mice 24 h after the intraperitoneal administration of Cmpd-A at 100 mg/kg. Black arrows indicate misaligned chromosomes in sections from COLO205 xenografts treated with Cmpd-A. (D) Antitumor efficacy of Cmpd-A in the COLO205 xenograft nude mouse model. COLO205 xenografted nude mice intraperitoneally injected with Cmpd-A at 100 mg/kg or vehicle three times (at 0, 8, and 24 h) on the first day of the study. Representative tumors 8 days after the administration of vehicle or Cmpd-A are shown. (E) Efficacy data plotted as the mean tumor volume (mm3 ± standard error of the mean; n = 5) in COLO205 xenograft nude mice treated with Cmpd-A (red) or vehicle (black). Statistical analysis was performed using Student’s t-test. Differences were considered significant at P ≤ 0.05 (*) and P ≤ 0.01 (**). (F) Bodyweight comparison of COLO205 xenograft nude mice 8 days after the administration of Cmpd-A (red) or vehicle (black). Data are presented as mean ± standard deviation (n = 5). Statistical analysis was performed using Student’s t-test. Differences were considered significant at P ≤ 0.05 (*) and P ≤ 0.01 (**).

