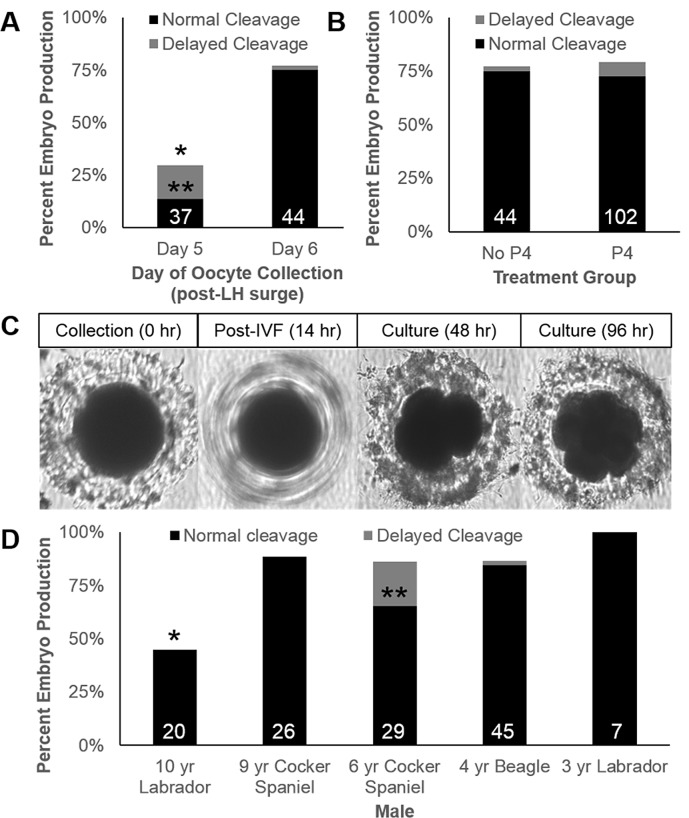
Fig 2. Development of embryos from Day 6 oocytes fertilized in vitro with sperm capacitated with Mg2+.
Normal cleavage = black bars, delayed cleavage = grey bars. (A) Proportion of oocytes collected on Day 5 versus Day 6 developing into embryos. Asterisks (*,**) indicate significant differences for day for total and delayed cleavage percentages, respectively, (B) Proportion of oocytes developing into embryos in unsupplemented versus P4-supplemented cNCSU, (C) An individual oocyte at collection though fertilization developing into an 8-cell embryo. A focused image of the presumptive zygote (14 hr mark) was not possible due to motility of attached sperm (D) Effect of male sperm donor on cleavage rates. Asterisks (*, **) indicate significant differences for that male in total and delayed cleavage, respectively.

