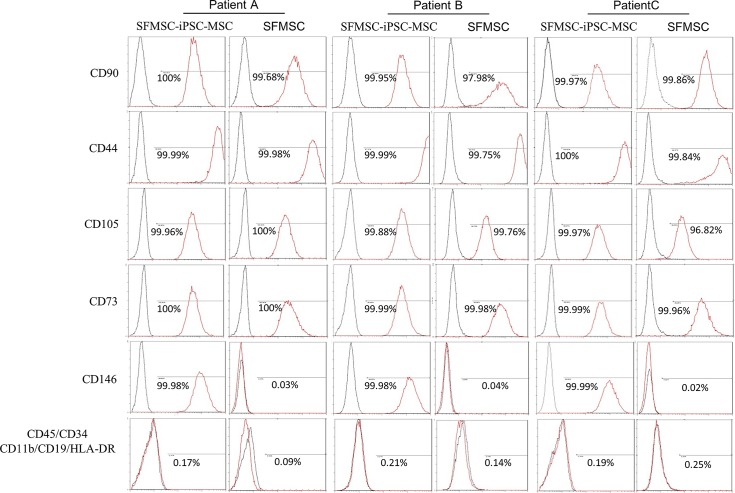
Fig 2. Flow cytometric analysis of SFMSCs and SFMSC-iPSC-MSCs.
Both SFCs and SFMSCs expressed typical MSCs surface markers, including CD90, CD44, CD105, and CD73. CD45, CD34, CD11b, CD19, and HLA-DR were not detected on the surfaces of these cells. SFMSC-iPSC-MSCs expressed CD146. The black lines represent negative controls, and the red lines are the results for the experimental groups.

