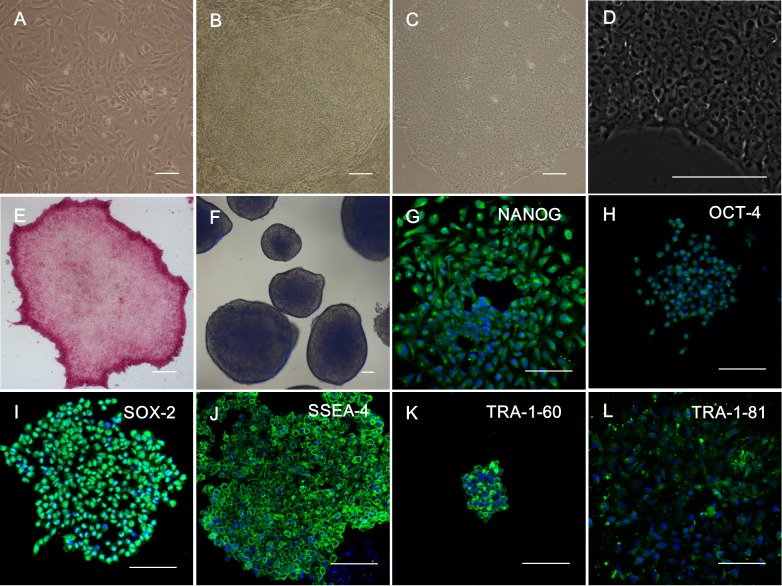
Fig 3. Induction of iPSCs from SFMSCs (Patient A).
(A) Microscopic image showing the morphology of SFMSCs after transfection for 4 days. (B) Microscopic image showing the morphology of SFMSCs after transfection for 20 days. (C) Typical image of hES cell-like colony after culture with Matrigel and mTeSR1 medium culture. (D) High-magnification image of SFMSC-iPSCs. (E) Staining of SFMSC-iPSCs showing positive expression of alkaline phosphatase. (F) Floating culture of SFMSC-iPSCs at day 8. Immunofluorescent staining of SFMSC-iPSCs showing positive expression of NANOG (G), OCT-4 (H), SOX-2 (I), SSEA-4 (J), TRA-1-60 (K), and TRA-1-81 (L). Scale bars = 100 μm.

