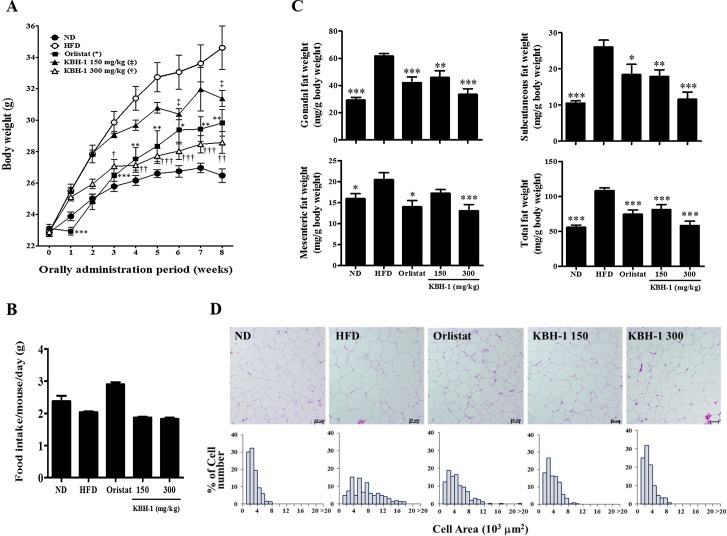
Fig 6. Effects of KBH-1 on high-fat diet (HFD)-induced obese mice.
For 8 weeks, (A) body weight changes and (B) food intake were measured. (C) Gonadal fat, subcutaneous fat and mesenteric fat were obtained from mice at the end of the study after an overnight fast and weighed. (D) Gonadal adipose tissue was stained with H&E and examined using a light microscope (magnification ×100). The areas of adipocyte distribution from H&E stained gonadal fat sections were expressed in a histogram. Data are expressed as the mean ± SEM (n = 9). Significant differences from the HFD group are indicated by * p < 0.05, ** p < 0.01 or *** p < 0.001.

