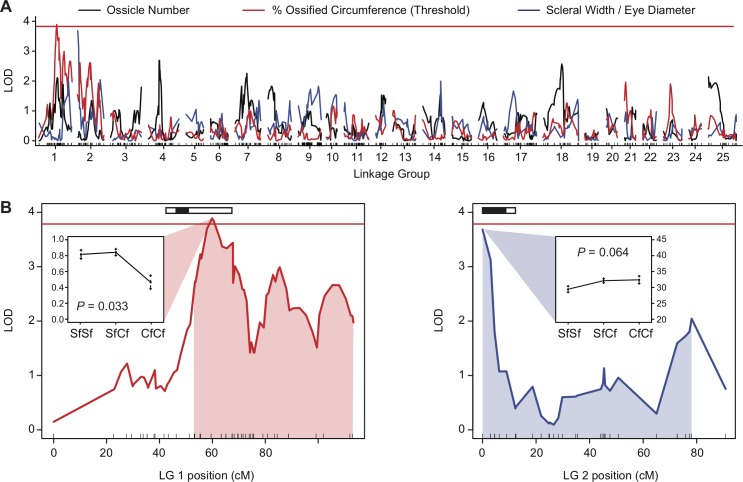
Fig 4. Quantitative trait loci (QTL) for Astyanax scleral ossification.
(A) Quantitative trait locus (QTL) mapping identified one QTL for the proportion or percent of the circumference of the eye occupied by scleral ossicles on linkage group (LG) 1, and another QTL for the relative width of the sclera on LG 2 that was marginally non-significant at P < 0.07. No QTL was found for ossicle number, though the power of this analysis was likely limited by the small number of F2 individuals with only 0 or 1 scleral ossicles (see Fig 3). Please refer to O’Quin et al. [29] for the complete genetic linkage map used in this analysis. (B) Detailed view of the scleral QTL on LGs 1 and 2. Red line indicates P = 0.05; any value above that threshold is considered statistically significant. Shaded fields indicate the 95% Bayesian confidence interval for the location of the QTL. Inset boxes show the mean phenotypes for each genotypic class at the peak QTL marker. Black and white boxes at the top of the chart indicate the position of eye or lens size QTL found in this (black) or other (white) studies (see also S1 Fig).

