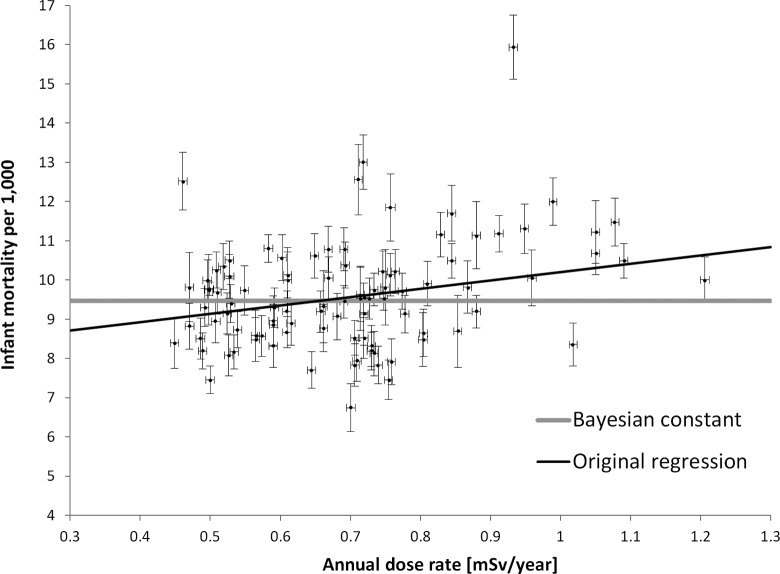
Figure 2.
Infant mortality rates (adapted from figure 2 of Körblein and Hoffmann, 2006) plotted against dose rate in mSv/year from terrestrial background exposure. The black thin line shows the best fit of the model assuming linear no threshold (LNT), while the horizontal gray line shows the result of applying the Bayesian model conforming to the observed mortality being dose independent. The error bars indicate 1 standard deviation.

